
Page 23 - BUSINESS DIRECTORY_2025
P. 23
14,658
14,152
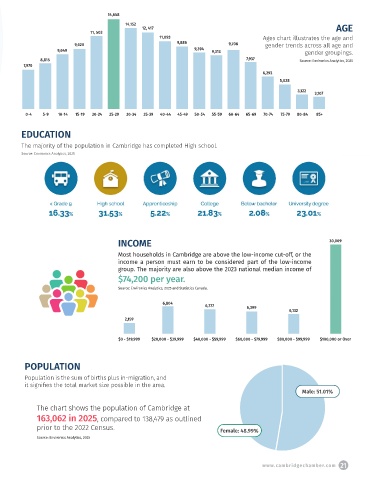
12, 417 AGE
11, 503
11,093 Ages chart illustrates the age and
9,886
9,620 9,706 gender trends across all age and
9,049 9,394 9,313 gender groupings.
8,815 7,937 Source: Environics Analytics, 2025
7,970
6,292
5,028
3,122
3,107
0-4 5-9 10-14 15-19 20-24 25-29 30-34 35-39 40-44 45-49 50-54 55-59 60-64 65-69 70-74 75-79 80-84 85+
EDUCATION
The majority of the population in Cambridge has completed High school.
Source: Environics Analytics, 2025
INCOME 30,009
Most households in Cambridge are above the low-income cut-off, or the
income a person must earn to be considered part of the low-income
group. The majority are also above the 2023 national median income of
$74,200 per year.
Source: Environics Analytics, 2025 and Statistics Canada.
6,804
6,777 6,399
6,132
2,159
$0 - $19,999 $20,000 - $39,999 $40,000 - $59,999 $60,000 - $79,999 $80,000 - $99,999 $100,000 or Over
POPULATION
Population is the sum of births plus in-migration, and
it signifies the total market size possible in the area.
Male: 51.01%
The chart shows the population of Cambridge at
163,062 in 2025, compared to 138,479 as outlined
prior to the 2022 Census.
Female: 48.99%
Source: Environics Analytics, 2025
www.cambridgechamber.com 21