
Page 25 - Packaging Controls
P. 25
GMP Training – Packaging Controls by www.gmpsop.com
Control charts
Control charts are statistical tools that are used to determine if a process is
capable of performing within specification limits. Control charts also provide
rules for changing or adjusting the process should it get "out of control".
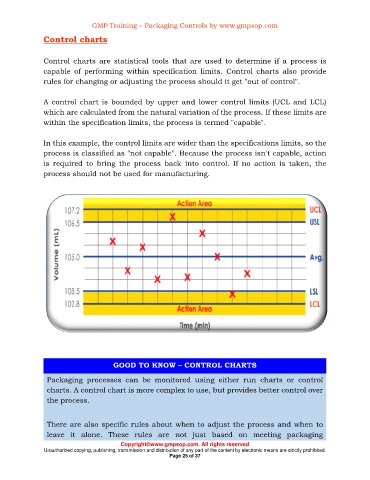
A control chart is bounded by upper and lower control limits (UCL and LCL)
which are calculated from the natural variation of the process. If these limits are
within the specification limits, the process is termed "capable".
In this example, the control limits are wider than the specifications limits, so the
process is classified as "not capable". Because the process isn't capable, action
is required to bring the process back into control. If no action is taken, the
process should not be used for manufacturing.
GOOD TO KNOW – CONTROL CHARTS
Packaging processes can be monitored using either run charts or control
charts. A control chart is more complex to use, but provides better control over
the process.
There are also specific rules about when to adjust the process and when to
leave it alone. These rules are not just based on meeting packaging
Copyright©www.gmpsop.com. All rights reserved
Unauthorized copying, publishing, transmission and distribution of any part of the content by electronic means are strictly prohibited.
Page 25 of 37