
Page 30 - COURSE DESIGN (EMBROIDERY)
P. 30
According to Figure 3.2, the pie chart shows the ages of respondents that were involved in this
need analysis. The respondents at age 21-30 recorded the highest number among the other
respondents followed by respondents at age 41-50, 20 and below, 51 and above and lastly 31-40.
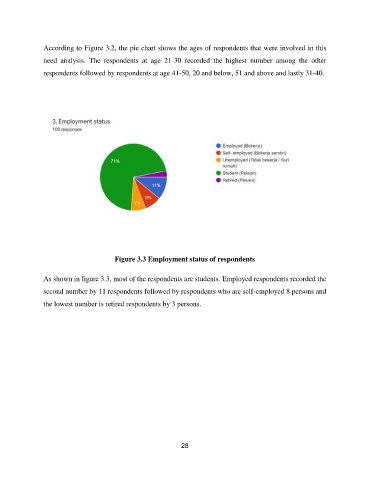
Figure 3.3 Employment status of respondents
As shown in figure 3.3, most of the respondents are students. Employed respondents recorded the
second number by 11 respondents followed by respondents who are self-employed 8 persons and
the lowest number is retired respondents by 3 persons.
28