
Page 31 - COURSE DESIGN (EMBROIDERY)
P. 31
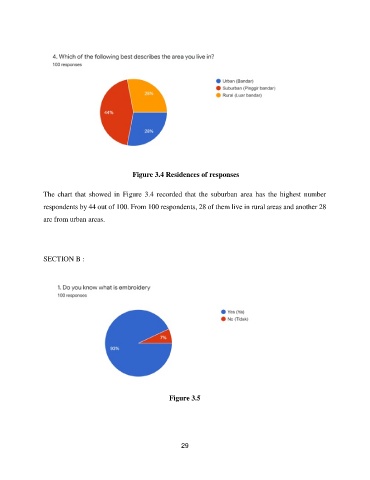
Figure 3.4 Residences of responses


               The  chart  that  showed  in  Figure  3.4  recorded  that  the  suburban  area  has  the  highest  number

               respondents by 44 out of 100. From 100 respondents, 28 of them live in rural areas and another 28
               are from urban areas.


               SECTION B :


                                                         Figure 3.5


                                                             29