Page 14 - AnnualReportFlip-2014
P. 14
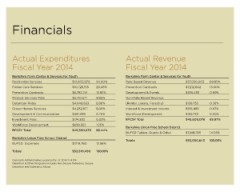
Financials
Actual Expenditures Actual Revenue
Fiscal Year 2014 Fiscal Year 2014
Berkshire Farm Center & Services for Youth Berkshire Farm Center & Services for Youth
Residential Services 24.00% $12,603,970Rate Based Revenue $37,056,003 69.85%
Foster Care Services $10,726,155 20.43% Prevention Contracts $7,212,602 13.60%
Prevention Contracts $6,782,741 12.92% Development & Events $525,493 0.99%
Medical Services Rate $5,170,671 9.85% Non-Rate Based Revenue
$4,649,833ental, Leases, Forestry)
Detention Rates 8.86% (R $138,752 0.26%
Group Homes Services $4,232,517 8.06% Interest & Investment Income $516,495 0.97%
Development & Communication $391,939 0.75% Workforce Development $159,733 0.30%
Investment Fees $174,292 0.33% BFCSY Total 85.97% $45,609,078
Workforce Development $658,552 1.25% Berkshire Union Free School District
BFCSY Total 86.44% $45,390,670
BUFSD Tuition, Grants & Other $7,441,765 14.03%
Berkshire Union Free School District Totals: 100.00% $53,050,843
BUFSD Expenses $7,119,780 13.56%
Totals: 100.00% $52,510,450
General & Administrative Expense for FY 2014 = 14.11%
Detention & Other Programs includes Non Secure Detention, Secure
Detention and Substance Abuse