
Page 42 - Practical book PC406-MNU-2025
P. 42
MANSOURA NATIONAL UNIVERSIY
PHARM D- CLINICAL PHARMACY LEVEL II INSTRUNENTAL ANALYSIS (PC 406)
S St te ep ps s o of f c co ol lo or ri im me et tr ri ic c d de et te er rm mi in na at ti io on n: :
1- Determination of max by drawing the Absorption Spectrum:
[Relation between A & …… using constant C].
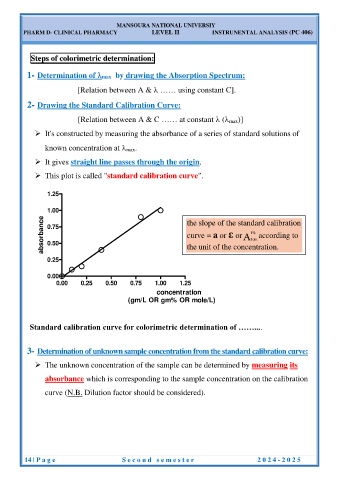
2- Drawing the Standard Calibration Curve:
[Relation between A & C …… at constant ( max)]
It's constructed by measuring the absorbance of a series of standard solutions of
known concentration at max.
It gives straight line passes through the origin.
This plot is called "standard calibration curve".
1.25
1.00
the slope of the standard calibration
absorbance 0.75 curve = a or ε or 1% according to
cm 1
0.50 the unit of the concentration.
0.25
0.00
0.00 0.25 0.50 0.75 1.00 1.25
concentration
(gm/L OR gm% OR mole/L)
Standard calibration curve for colorimetric determination of ……....
3- Determination of unknown sample concentration from the standard calibration curve:
The unknown concentration of the sample can be determined by measuring its
absorbance which is corresponding to the sample concentration on the calibration
curve (N.B. Dilution factor should be considered).
14 | P a g e S e c o n d s e m e s t e r 2 0 2 4 - 2 0 2 5