
Page 16 - PD Experience on 3-5kV
P. 16
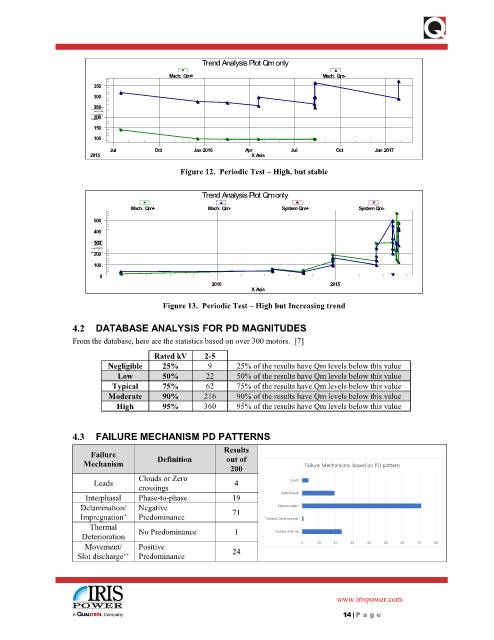
Trend Analysis Plot Qm only
                                           Mach. Qm+                             Mach. Qm-
                        350
                        300
                        250
                           xis
                            A
                        200Y
                        150
                        100
                            Jul        Oct       Jan 2016     Apr        Jul        Oct       Jan 2017
                       2015                                    X Axis
                                              Figure 12.  Periodic Test – High, but stable

                                                   Trend Analysis Plot Qm only

                                 Mach. Qm+           Mach. Qm-         System Qm+         System Qm-
                        500
                        400
                        300xis
                            A
                        200  Y
                        100
                          0
                                                     2010                          2015
                                                               X Axis
                                         Figure 13.  Periodic Test – High but Increasing trend


                   4.2  DATABASE ANALYSIS FOR PD MAGNITUDES
                   From the database, here are the statistics based on over 300 motors.  [7]
                                       Rated kV     2-5
                            Negligible   25%         9      25% of the results have Qm levels below this value
                              Low        50%        22      50% of the results have Qm levels below this value
                             Typical     75%        62      75% of the results have Qm levels below this value
                            Moderate     90%        216     90% of the results have Qm levels below this value
                              High       95%        360     95% of the results have Qm levels below this value

                   4.3  FAILURE MECHANISM PD PATTERNS

                        Failure                          Results
                      Mechanism         Definition       out of             Failure Mechanisms based on PD pattern
                                                          200
                                   Clouds or Zero
                        Leads                              4             Leads
                                   crossings
                      Interphasal   Phase-to-phase         19          Interphasal
                     Delamination/   Negative              71         Delamination
                                +
                     Impregnation    Predominance                  Thermal Deterioration
                       Thermal     No Predominance         1         Surface Activity
                     Deterioration
                      Movement/    Positive                                 0   10  20  30  40  50  60  70   80
                    Slot discharge   Predominance          24
                                ++


                                                                                     www.irispower.com
                                                                                      14 | P age