
Page 15 - PD Experience on 3-5kV
P. 15
4 DATABASE ANALYSIS
4.1 TRENDS
Several different analyses were done on the Iris database to evaluate the long-term trend. Over 200 long-term
trends were evaluated from PD results collected using EMCs as the PD sensor on machines rated 3-5kV. It is
interesting to note in the table below that almost 26% of the results indicate fluctuations with ambient and/or
operating conditions. It is also notable that 5% show an increase in the trend.
Trend Definition % results
Baseline Initial test 29% TRENDS
Stable Within ± 25% 39% Fluctuations
26%
Upward > 25%, but less than Rapid 4% Stable
39%
Rapid > 100% in 6 months 1% Rapid
1%
Downward < 75% over 6 months 1%
Influenced by variable Baseline Upward
Fluctuations 26% Downward 4%
conditions [Figure 10] 29% 1%
4.1.1 Continuous Monitors
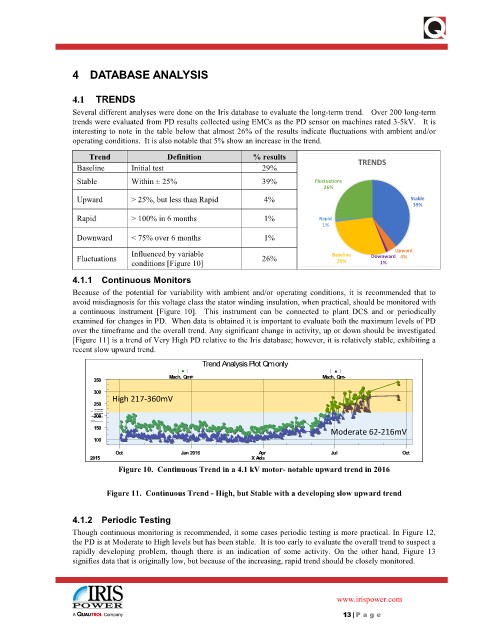
Because of the potential for variability with ambient and/or operating conditions, it is recommended that to
avoid misdiagnosis for this voltage class the stator winding insulation, when practical, should be monitored with
a continuous instrument [Figure 10]. This instrument can be connected to plant DCS and or periodically
examined for changes in PD. When data is obtained it is important to evaluate both the maximum levels of PD
over the timeframe and the overall trend. Any significant change in activity, up or down should be investigated
[Figure 11] is a trend of Very High PD relative to the Iris database; however, it is relatively stable, exhibiting a
recent slow upward trend.
Trend Analysis Plot Qm only
Mach. Qm+ Mach. Qm-
350
300
High 217-360mV
250
xis
200 A
Y
150 Moderate 62-216mV
100
Oct Jan 2016 Apr Jul Oct
2015 X Axis
Figure 10. Continuous Trend in a 4.1 kV motor- notable upward trend in 2016
Figure 11. Continuous Trend - High, but Stable with a developing slow upward trend
4.1.2 Periodic Testing
Though continuous monitoring is recommended, it some cases periodic testing is more practical. In Figure 12,
the PD is at Moderate to High levels but has been stable. It is too early to evaluate the overall trend to suspect a
rapidly developing problem, though there is an indication of some activity. On the other hand, Figure 13
signifies data that is originally low, but because of the increasing, rapid trend should be closely monitored.
www.irispower.com
13 | P age