
Page 15 - Review Jurnal (Ayu Repi)
P. 15
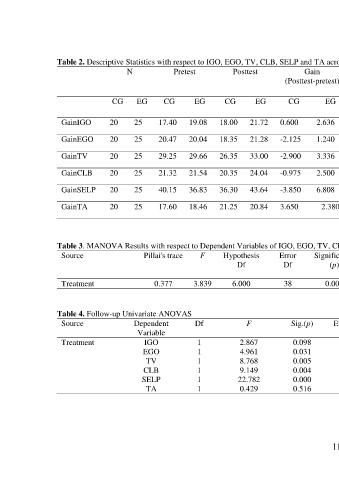
Table 2. Descriptive Statistics with respect to IGO, EGO, TV, CLB, SELP and TA across the Groups
                                 N          Pretest        Posttest          Gain            Skewness          Kurtosis         Standard
                                                                        (Posttest-pretest)                                      Deviation

                             CG    EG     CG     EG      CG     EG       CG       EG       CG       EG       CG       EG      CG      EG

                GainIGO     20    25    17.40   19.08   18.00   21.72   0.600   2.636     0.179    0.072    0.767    -0.483   4.109   3.925

                GainEGO     20    25    20.47   20.04   18.35   21.28   -2.125   1.240    -0.081   1.811    -1.370   5.382   4.103   5.666

                GainTV      20    25    29.25   29.66   26.35   33.00   -2.900   3.336    -0.380   0.101    1.214    3.073   9.706   3.702
                GainCLB     20    25    21.32   21.54   20.35   24.04   -0.975   2.500    -0.042   0.701    -0.188   1.665   3.514   4.062

                GainSELP    20    25    40.15   36.83   36.30   43.64   -3.850   6.808    0.220    0.434    -1.557   -0.149   7.693   7.239
                GainTA      20    25    17.60   18.46   21.25   20.84   3.650    2.380    1.319    0.188    1.941    -0.255   4.373   7.726


               Table 3. MANOVA Results with respect to Dependent Variables of IGO, EGO, TV, CLB, SELP, TA
                Source               Pillai's trace   F   Hypothesis   Error    Significance   Eta   Power
                                                            Df         Df          (p)     Squared
                                                                                              2
                                                                                             µ )
                Treatment              0.377     3.839     6.000        38        0.004     0.377    0.935


               Table 4. Follow-up Univariate ANOVAS
                Source            Dependent      Df           F          Sig.(p)    Eta-Squared   Observed
                                   Variable                                                        Power
                Treatment            IGO          1          2.867        0.098        0.063       0.381
                                     EGO          1          4.961        0.031        0.103       0.586
                                     TV           1          8.768        0.005        0.169       0.825
                                     CLB          1          9.149        0.004        0.175       0.840
                                    SELP          1         22.782        0.000        0.346       0.997
                                     TA           1          0.429        0.516        0.010       0.098


                                                                                    110