Page 14 - New Allen Alliance Digital Book
P. 14

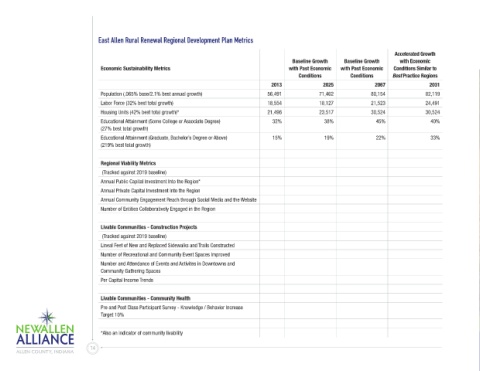
East Allen Rural Renewal Regional Development Plan Metrics

                                                                                                                                        Accelerated Growth
                                                                                                      Baseline Growth   Baseline Growth   with Economic
                                       Economic Sustainability Metrics                               with Past Economic   with Past Economic   Conditions Similar to
                                                                                                        Conditions       Conditions    Best Practice Regions
                                                                                               2013             2025             2067              2031
                                      Population (.065% base/2.1% best annual growth)         56,491           71,462           80,154            82,119
                                      Labor Force (32% best total growth)                     18,554           18,127           21,523            24,491
                                      Housing Units (42% best total growth)*                  21,496           23,517           30,524            30,524
                                      Educational Attainment (Some College or Associate Degree)    32%          38%              45%               40%
                                      (27% best total growth)
                                      Educational Attainment (Graduate, Bachelor’s Degree or Above)    15%      19%              22%               33%
                                      (219% best total growth)


                                      Regional Viability Metrics
                                       (Tracked against 2019 baseline)
                                      Annual Public Capital Investment Into the Region*
                                      Annual Private Capital Investment Into the Region
                                      Annual Community Engagement Reach through Social Media and the Website
                                      Number of Entities Collaboratively Engaged in the Region


                                      Livable Communities - Construction Projects
                                       (Tracked against 2019 baseline)
                                      Lineal Feet of New and Replaced Sidewalks and Trails Constructed
                                      Number of Recreational and Community Event Spaces Improved
                                      Number and Attendance of Events and Activites in Downtowns and
                                      Community Gathering Spaces
                                      Per Capital Income Trends


                                      Livable Communities - Community Health
                                      Pre and Post Class Participant Survey - Knowledge / Behavior Increase
                                      Target 10%


                                      *Also an indicator of community livability

                                   14


       EARR PLAN.indd   14                                                                                                                              11/13/18   10:47 AM
   9   10   11   12   13   14   15   16   17   18   19