Page 31 - NSAA_Fall2015Journal
P. 31

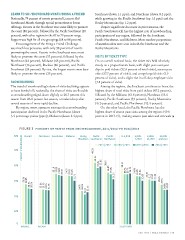
LEARN TO SKI/SNOWBOARD MONTH/BRING A FRIEND                                                 Southeast (down 1.1 ppts), and Northeast (down 0.2 ppts),

Nationally, 79 percent of resorts promoted Learn to Ski/                                    while growing in the Pacific Southwest (up 1.4 ppts) and the

Snowboard Month through special promotions or lesson                                        Rocky Mountains (up 1.2 ppts).
of6f0er0ings. ResoOrvtesrainll the NorthNeoartshtewasetre most liSkoeulythteoasptromote Midwest DespiRteocskiygMniofuicntaanint dePcarceiasceSsoiunthpwreisotr sPeaacsionc Ns,otrthhewest
     SNOWFALL (INCHES)
                                                                                                                                                      333

                                                                                                                                                           530
                                                                                                                                                               451
                                                                                                                                                                   377
the event (88 percent), followed by the Pacific Southwest (82                                Pacific Southwest still has the highest rate of snowboarding
percent), with oth24e-rSreeagsoionnAvseirnagtehe(9617/9t2o-7149/1p5e)rcent r2a0n1g1e|.2012  2p01a2rt|i2c0ip13ation o2f01a3n|y2r0e1g4ion, fo2l0l1o4w|e2d01b5y the Southeast,
Su5p00port was high for all size groupings (68 to 88 percent).                               Pacific Northwest, and Midwest. More modest proportions

Encouragement of the Bring a Friend Challenge                                               of snowboarders were seen in both the Northeast and the

was much less pervasive, with only 38 percent of resorts                                    Rocky Mountains.

pr4o0m0 oting the event. Resorts in the Southeast were most                                 VISITS BY TICKET TYPE
likely to promote the event (52 percent), followed by the

Northeast (44 percent), Midwest (43 percent), Pacific                                       On an overall national basis, the ticket mix held relatively

N3o0r0thwest (36 percent), Rockies (26 percent), and Pacific                                steady on a proportionate basis, with slight year-over-year
Southwest (24 percent). By size, the largest resorts were least                             dips in paid tickets (52.6 percent of total visits), season pass
                                                                                            268                         277
                                                                                                210                         217
                                                                                                    214                         228

                                                                                                        277
                                                                                                             204
likely to promote the event (25 percent).                                                   visits (37.7 percent of visits), and comp/unpaid visits (5.9
                                                                                                                                                                        204
     180                                                                                    percent of visits), and a slight rise in off-duty employee visits
         149                                                                                (3.8 percent of visits).

             172
                 187

                      141
SN20O0WBOARDING

The trend of snowboarding’s share of visits declining appears                               Among the regions, the Southeast continues to boast the
                           136                                                                                                        157
                                   149                                                                                                    89
                                       150
                                            157
to have leveled off; nationally, the share of visits attributable highest share of total visits from paid tickets (67.2 percent),
                                                                      75
to snowboarding edged down slightly to 26.7 percent this                  53                followed by the Midwest (61.8 percent), Northeast (55.4

se1a0s0on from 26.8 percent last season, a modest drop after92                90            percent), Pacific Southwest (53 percent), Rocky Mountains
                                                 65                               117
several seasons of more rapid decline.               28
                                                                                       74
                                                         66                                 (47.3 percent), and Pacific Northwest (42.4 percent).
                                                             83

                                                                  66
By region, resort operators estimate that snowboarding                                      On the other hand, the Pacific Northwest has the

participation declined in the Pacific Northwest (down                                       highest share of season pass visits among the regions (49.6
3.4 0percentage points [ppts]), Midwest (down 2.4 ppts),                                    percent in 2014-15), making season pass sales and renewals

     FIGURE 3 PERCENT OF VISITS FROM SNOWBOARDERS, 2011/2012 TO 2014/2015

60% OverallPERCENT SNOWBOARDERSNortheast Southeast Midwest Rocky Paci c Paci c                                          0-2,999 3,000- 6,000- 12,000
                                                                   Mountain Southwest Northwest                                       5,999 11,999 and over

                                                                                            2011 | 2012                 2012 | 2013   2013 | 2014  2014 | 2015

50%                                    35.1%
                                          35.0%
40%                                          34.6%                                                                      38.6%
                                                 33.5%                                                                     35.7%
30%  29.9%                                             34.7%                                                                  35.7%
        28.9%                                             33.8%                                                                   36.7%
           26.8%                                             33.2%                                                                     34.8%
               26.7%                                             30.7%                                                                    33.9%
                                                                                                                                             33.6%
                                                                                       49.3%                                                     30.0%
                                                                                          42.3%                                                       32.3%
                                                                                             38.4%                                                       31.2
                                                                                                 39.8%                                                       30.6%
                                                                                                       39.1%                                                    30.4%
                                                                                                          36.9%                                                      28.5%
                                                                                                             35.0%                                                       27.5%
                                                                                                                 31.6%                                                      24.6%
                                                                                                                                                                               25.0%
                           25.8%
                              25.3%
                                 24.8%
                                     24.7%
                                                                           24.7%
                                                                              24.2%
                                                                                 21.9%
                                                                                     23.1%

20%

10%

0                          REGION                                                                                       SIZE (VTF/H)

     OVERALL

                                                                                                                                      FALL 2015 | NSAA JOURNAL | 29
   26   27   28   29   30   31   32   33   34   35   36