
Page 22 - Pharmaceutical Analytical Chemistry II - Pharm D Clinical- 07-PA202
P. 22
Redox titration curves
Because most redox indicators respond to changes in electrode
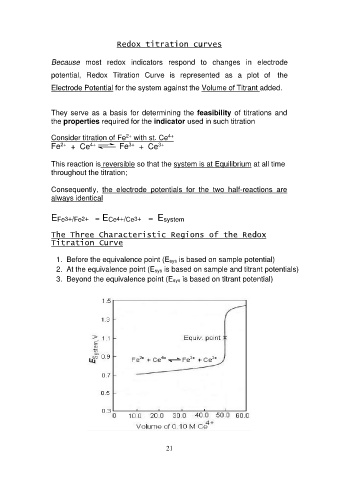
potential, Redox Titration Curve is represented as a plot of the
Electrode Potential for the system against the Volume of Titrant added.
They serve as a basis for determining the feasibility of titrations and
the properties required for the indicator used in such titration
Consider titration of Fe2+ with st. Ce4+
Fe2+ + Ce4+ Fe3+ + Ce3+
This reaction is reversible so that the system is at Equilibrium at all time
throughout the titration;
Consequently, the electrode potentials for the two half-reactions are
always identical
EFe3+/Fe2+ = ECe4+/Ce3+ = Esystem
The Three Characteristic Regions of the Redox
Titration Curve
1. Before the equivalence point (Esys is based on sample potential)
2. At the equivalence point (Esys is based on sample and titrant potentials)
3. Beyond the equivalence point (Esys is based on titrant potential)
21