Page 56 - Green Builder July-August 2020 Issue
P. 56

FIRST FLOOR
                                                                           Level       Average Temperature (°C)     Error (%)

                       GROUND FLOOR                                     Ground Floor             20.06               -4.48%
                                                                           Office
                                                                                                 21.35
                                                                                                                     1.66%


                                                                         First Floor
                                                                                                                     0.30%
                                                                                                 21.06
                                                                        Second Floor             20.68               -1.54%

                                                                          Average                20.79               -1.01%


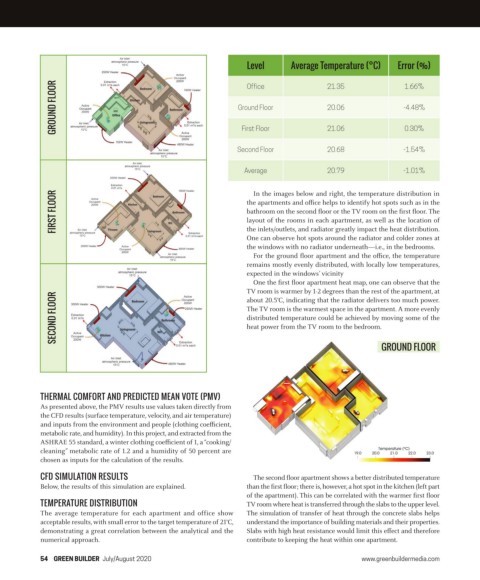
                                                                             In the images below and right, the temperature distribution in
                       FIRST FLOOR                                         the apartments and oce helps to identify hot spots such as in the
                                                                           bathroom on the second ‘oor or the TV room on the ’rst ‘oor. The
                                                                           layout of the rooms in each apartment, as well as the location of
                                                                           the inlets/outlets, and radiator greatly impact the heat distribution.
                                                                           One can observe hot spots around the radiator and colder zones at
                                                                           the windows with no radiator underneath—i.e., in the bedrooms.
                                                                             For the ground ‘oor apartment and the oce, the temperature
                                                                           remains mostly evenly distributed, with locally low temperatures,
                                                                           expected in the windows’ vicinity
                                                                             One the ’rst ‘oor apartment heat map, one can observe that the
                                                                           TV room is warmer by …-‰ degrees than the rest of the apartment, at
                       SECOND FLOOR                                        The TV room is the warmest space in the apartment. A more evenly
                                                                           about ‰Š.ƒ°C, indicating that the radiator delivers too much power.
                                                                           distributed temperature could be achieved by moving some of the
                                                                           heat power from the TV room to the bedroom.

                                                                                                               GROUND FLOOR


                   THERMAL COMFORT AND PREDICTED MEAN VOTE (PMV)
                   As presented above, the PMV results use values taken directly from
                   the CFD results (surface temperature, velocity, and air temperature)
                   and inputs from the environment and people (clothing coecient,
                   metabolic rate, and humidity). In this project, and extracted from the
                   ASHRAE ƒƒ standard, a winter clothing coecient of …, a “cooking/
                   cleaning” metabolic rate of ….‰ and a humidity of ƒŠ percent are
                   chosen as inputs for the calculation of the results.

                   CFD SIMULATION RESULTS                                    The second ‘oor apartment shows a better distributed temperature
                   Below, the results of this simulation are explained.    than the ’rst ‘oor; there is, however, a hot spot in the kitchen (left part
                                                                           of the apartment). This can be correlated with the warmer ’rst ‘oor
                   TEMPERATURE DISTRIBUTION                                TV room where heat is transferred through the slabs to the upper level.
                   The average temperature for each apartment and office show   The simulation of transfer of heat through the concrete slabs helps
                   acceptable results, with small error to the target temperature of ‰…°C,   understand the importance of building materials and their properties.
                   demonstrating a great correlation between the analytical and the   Slabs with high heat resistance would limit this e™ect and therefore
                   numerical approach.                                     contribute to keeping the heat within one apartment.

                   54  GREEN BUILDER July/August 2020                                                     www.greenbuildermedia.com


          52-55 GB 0720 IAQ.indd   54                                                                                           8/12/20   1:27 PM
   51   52   53   54   55   56   57   58   59   60   61