
Page 57 - Green Builder July-August 2020 Issue
P. 57
www.greenbuildermedia.com/iaq-home-page-green-builder
FIRST FLOOR
PMV
century, when the insulation of windows was poor (high U-values),
this eect was particularly desired, which is why radiators have been
traditionally installed under the windows.
FINAL ANALYSIS
As shown in this project, CFD simulation is a valuable tool in
accurately predicting energy consumption, leading to a more
environmentally friendly building while guaranteeing a suitable
level of thermal comfort.
The hand calculation values for evaluating the radiator heat
power for each level were conrmed by the CFD results, leading to
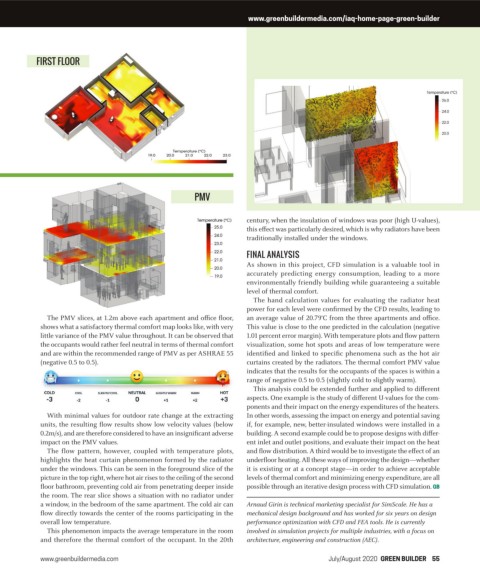
The PMV slices, at . m above each apartment and o ce oor, an average value of .°C from the three apartments and o ce.
shows what a satisfactory thermal comfort map looks like, with very This value is close to the one predicted in the calculation (negative
little variance of the PMV value throughout. It can be observed that . percent error margin). With temperature plots and ow pattern
the occupants would rather feel neutral in terms of thermal comfort visualization, some hot spots and areas of low temperature were
and are within the recommended range of PMV as per ASHRAE identied and linked to specic phenomena such as the hot air
(negative . to .). curtains created by the radiators. The thermal comfort PMV value
indicates that the results for the occupants of the spaces is within a
range of negative . to . (slightly cold to slightly warm).
This analysis could be extended further and applied to dierent
aspects. One example is the study of dierent U-values for the com-
ponents and their impact on the energy expenditures of the heaters.
With minimal values for outdoor rate change at the extracting In other words, assessing the impact on energy and potential saving
units, the resulting ow results show low velocity values (below if, for example, new, better-insulated windows were installed in a
. m/s), and are therefore considered to have an insignicant adverse building. A second example could be to propose designs with dier-
impact on the PMV values. ent inlet and outlet positions, and evaluate their impact on the heat
The flow pattern, however, coupled with temperature plots, and ow distribution. A third would be to investigate the eect of an
highlights the heat curtain phenomenon formed by the radiator under oor heating. All these ways of improving the design—whether
under the windows. This can be seen in the foreground slice of the it is existing or at a concept stage—in order to achieve acceptable
picture in the top right, where hot air rises to the ceiling of the second levels of thermal comfort and minimizing energy expenditure, are all
oor bathroom, preventing cold air from penetrating deeper inside possible through an iterative design process with CFD simulation. GB
the room. The rear slice shows a situation with no radiator under
a window, in the bedroom of the same apartment. The cold air can Arnaud Girin is technical marketing specialist for SimScale. He has a
ow directly towards the center of the rooms participating in the mechanical design background and has worked for six years on design
overall low temperature. performance optimization with CFD and FEA tools. He is currently
This phenomenon impacts the average temperature in the room involved in simulation projects for multiple industries, with a focus on
and therefore the thermal comfort of the occupant. In the th architecture, engineering and construction (AEC).
www.greenbuildermedia.com July/August 2020 GREEN BUILDER 55
52-55 GB 0720 IAQ.indd 55 8/12/20 1:27 PM