
Page 4 - 2621 NE 11th Ter Pompano Beach
P. 4
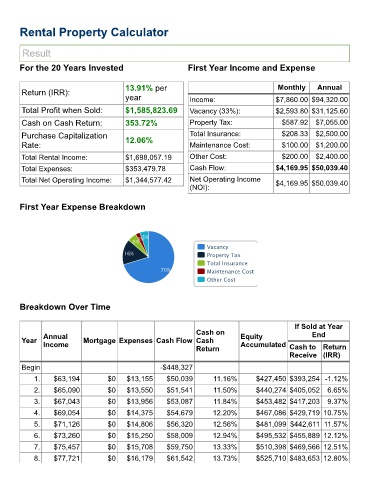
Rental Property Calculator


        Result

        For the 20 Years Invested                              First Year Income and Expense


                                           13.91% per                                        Monthly      Annual
        Return (IRR):
                                           year                 Income:                     $7,860.00 $94,320.00

        Total Profit when Sold:            $1,585,823.69        Vacancy (33%):              $2,593.80 $31,125.60
        Cash on Cash Return:               353.72%              Property Tax:                 $587.92    $7,055.00

        Purchase Capitalization            12.06%               Total Insurance:              $208.33    $2,500.00
        Rate:                                                   Maintenance Cost:             $100.00    $1,200.00

        Total Rental Income:               $1,698,057.19        Other Cost:                   $200.00    $2,400.00
        Total Expenses:                    $353,479.78          Cash Flow:                  $4,169.95 $50,039.40
        Total Net Operating Income:        $1,344,577.42        Net Operating Income        $4,169.95 $50,039.40
                                                                (NOI):


        First Year Expense Breakdown


                                              3% 5%
                                             6%
                                                                      Vacancy
                                          16%                         Property Tax
                                                                      Total Insurance
                                                      70%             Maintenance Cost
                                                                      Other Cost


        Breakdown Over Time


                                                                                                   If Sold at Year
                                                                  Cash on
               Annual                                                            Equity                 End
        Year                 Mortgage Expenses Cash Flow Cash
               Income                                                            Accumulated
                                                                  Return                         Cash to Return
                                                                                                 Receive (IRR)
        Begin                                        -$448,327
            1.     $63,194           $0    $13,155      $50,039         11.16%        $427,450 $393,254 -1.12%

            2.     $65,090           $0    $13,550      $51,541         11.50%        $440,274 $405,052      6.65%
            3.     $67,043           $0    $13,956      $53,087         11.84%        $453,482 $417,203      9.37%
            4.     $69,054           $0    $14,375      $54,679        12.20%         $467,086 $429,719 10.75%

            5.     $71,126           $0    $14,806      $56,320        12.56%         $481,099 $442,611 11.57%
            6.     $73,260           $0    $15,250      $58,009        12.94%         $495,532 $455,889 12.12%
            7.     $75,457           $0    $15,708      $59,750        13.33%         $510,398 $469,566 12.51%

            8.     $77,721           $0    $16,179      $61,542        13.73%         $525,710 $483,653 12.80%