
Page 373 - Atlas Sea Birds Ver1
P. 373
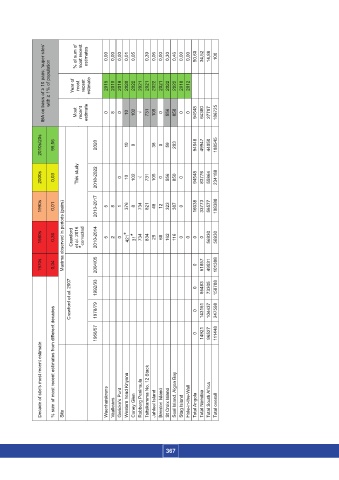
IBA on basis of ≥ 10 pairs; 'super sites'   with ≥ 1% of population  Year of   % of sum of   Most   most   most recent   recent   recent      estimates  estimate  estimate     0,00  2015  0  0,00  2015  8  0,00  2018  0  0,01  2020  10  0,05  2022  102  2021  √  0,39  2021  731  0,06  2022  105  0,00  2021  0  0,30  2022  556  0,46  2022  850  0,00  2018  0  0,00  2012  0  50,60     94548  34,52     64380  14,88     27797  100     186725


                     2010s/20s  99,56    2020           10  0        38  0  59  203        94548  49947  44050  188545


                     2000s  0,03  This study  2018-2022     0  10  102  √  731  105  0  556  850  0     94548  83776  55864  234188


                     1990s  0,01         2013-2017  5  8  1  376  8  734  821  48  12  323  387  0     16038  33773  58577  108388


                     1980s  0,36 Maxima observed in periods (pairs)  Crawford   et al. 2016   *corrected  2010-2014  5  2  0  421*  31*  734  834  25  68  162  116  0  0  0  0  56930  56930


                     1970s  0,04         2004/05                                         0  51857  49531  101388


                                Crawford et al. 2007        1992/93  1978/79                                                                                0  0  85483  143161  73305  104437  158788  247598


                                         1956/57                            0  14921  96527  111448

                     Decade of site's most recent estimate % sum of most recent estimates from different decades  Site  Waenhuiskrans  Vaalkrans  Gericke's Punt  Western head Knysna  Coney Glen  Robberg Peninsula  Tsitsikamma No. 12 Stack  Jahleel Island  Brenton Island  St Croix Island  Seal Island, Algoa Bay  Stag Island  Hole-in-the-Wall  Total Angola  Total Namibia  Total South Africa  Total overall


                                                                 367