
Page 496 - Atlas Sea Birds Ver1
P. 496
2010/20s 79.34 2010s 2 102
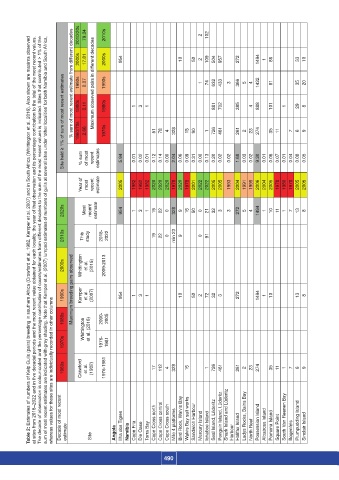
sum of most recent estimates are indicated with grey shading. Note that Kemper et al. (2007) lumped estimates of numbers of gulls at several sites under ‘other localities’ for both Namibia and South Africa,
The decade of observation is colour-coded and the percentage contribution of counts/estimates from different decades to the sum of the most recent values is indicated. Sites that contributed > 1% of the
Table 2: Estimates of numbers of Kelp Gulls (pairs) breeding in southern Africa (Crawford et al. 1982, Kemper et al. 2007) and in South Africa (Whittington et al. 2016). Also shown are maxima observed
at sites from 2018–2022 and in five decadal periods and the most recent value obtained for each locality, the year of that observation and its percentage contribution to the total of the most recent values.
2000s % sum of most recent estimate from different decades 1990s 17.81 0.07 Maximum observed pairs in different decades 2000s 1990s 954 10 50 2 1 109 74 504 632 957 433 3 272 366 5 4 1494 1432 1 86 81 33 35 10 20
Site held ≥ 1% of sum of most recent estimates 1980s 1960/70s 0.11 2.66 1980s 1970s 1 3 1 51 78 4 328 15 90 1 881 726 702 461 385 261 2 4 23 888 274 101 35 11 1 7 29 6 8 9
Year of % sum of most most recent recent estimates 5.94 2005 0.01 1982 0.02 1982 0.01 1982 0.12 2020 0.14 2020 0.00 2020 2.04 1978 0.06 2020 0.09 1978 0.31 2001 0.00 2022 0.13 2022 0.20 2005 0.02 2005 0.02 1993 1.69 2004 0.03 1991 0.02 1995 9.30 2006 0.01 2004 0.06 2005 0.07 1978 0.01 1980 0.04 1978 0.08 2005 0.05 2005
estimate
2020s Most Most recent recent estimate estimate 954 1 3 1 19 22 0 328 9 15 50 0 21 32 3 3 272 5 4 1494 1 10 11 1 7 13 8
2010s This This study study 2018- 2022 19 22 0 min 23 9 0 91
2000s Whittington et al. (2016) 2009-2013
1990s Maximum breeding pairs observed Kemper Kemper et al. et al. (2007) (2007) 954 1 3 1 10 50 2 72 32 3 272 1494 1 10 13 8
whereas values for these sites are individually recorded in other columns
1980s Whittington 2000- 2005
1970s et al. (2016) 1976- 1981
1960s Crawford et al. (1982) 1976-1981 17 112 4 328 15 1 726 461 261 2 23 274 35 11 1 7 6 9
Decade of most recent estimate Site Site Angola Ilha dos Tigres Namibia Cape Fria Die Oase Torra Bay Cape Cross north Cape Cross central Cape Cross south Mile 4 platforms Bird Rock, Walvis Bay Walvis Bay salt works Sandwich Harbour Mercury Island Ichaboe Island Seal Island, Lüderitz Penguin Island, Lüderitz Shark Island and Lüderitz Harbour Halifax Island Ladys Rocks, Bains Bay North Reef Possession Island Albatross Island Pomona Island Square Point Sout
490