
Page 497 - Atlas Sea Birds Ver1
P. 497
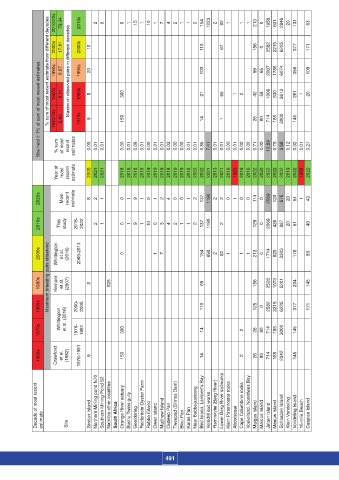
2010/20s  79.34  2010s     2  0        0  1  15  1  10  1  7  4  2  1  1  2  154  1223  2  82  1     1  1  213  0  1956  631  2846  20  131  63


                          2000s % sum of most recent estimate from different decades  1990s  17.81  0.07 Maximum observed pairs in different decades  2000s  1990s  10  20                                                                                         110  100  67  156  99  0  65  2582  2067  2215  1786  6225  6074  377  356  171  109


                     Site held ≥ 1% of sum of most recent estimates  1980s  1960/70s  0.11  2.66  1980s  1970s  8  9              300  150        21  14  65  1  1  2  42  26  58  80  1009  714  530  185  3613  3000  261  145  1  20


                           Year of   % sum   of most   most   recent   recent   estimates  estimate  0.05  2005  0.01  2021  0.01  2021        0.00  2018  0.01  2018  0.06  2018  0.01  2018  0.00  2019  0.01  2019  0.01  2019  0.02  2018  0.00  2019  0.00  2019  0.01  2018  0.01  2022  0.85  2022  7.41  2021  0.01  2013  0.01  2021  0.00  2016  0.01  1983  0.00  2016  0.00  2016  0.71  2022  0.00  2020  12.89  2022  0.75  2022  3.58  2022  0.12  2019  0.32  2022  0.01  1988  0.27  2022


                     2020s   Most   recent  estimate     8  2  1        0  1  9  1  0  1  2  4  0  0  1  2  137  1190  2  2  0  1  0  0  114  0  2069  120  575  20  51  1  43


                     2010s  This  study     2018-  2022     2  1        0  1  9  1  10  0  3  4  2  1  1  2  137  1190     2  129  0  2069  426  887  20  51  49


                     2000s  Whittington  et al.   (2016)     2009-2013                 0              1  7                 154  698  2  82  1     1  1  213  0  1714  825  3303     178     83


                     1990s Maximum breeding pairs observed  Kemper  et al.   (2007)  8        525                                         69                       156     2528  1073  5201     234     145


                     1980s        2000-  2005                                                     110                       125  0  2582  2215  6225     377     171


                     1970s  Whittington  et al. (2016)     1976-  1981              300                                   14                 2     26  80  714  185  3000     145


                     1960s  Crawford   et al.   (1982)  1976-1981  9              150                                   14                 2     26  80  714  185  2342     145


                    Decade of most recent   estimate  Site          Site     Sinclair Island  Northern Mining pond N70  Southern Mining Pond S2  Namibia other localities  South Africa  Orange River estuary  Buchu Twins gully  Geeldoring  Reitfontein Oyster Farm  Robbe Eiland  Owen Island  Matthew Island  Oubeep Pan  Tweepad (Slimes Dam)  Blou Pan  Karas Pan  Near Bobbejaanberg  Bird Island, Lambert's Bay  Velddrif salt works  Flaminkvlei (Berg River) Lower Berg River saltworks   Klein Paternoster rocks  Abdolsbaai


                                                                 491