
Page 546 - Atlas Sea Birds Ver1
P. 546
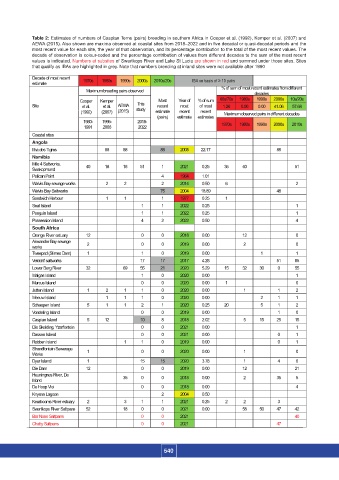
Table 2: Estimates of numbers of Caspian Terns (pairs) breeding in southern Africa in Cooper et al. (1992), Kemper et al. (2007) and
                  AEWA (2015). Also shown are maxima observed at coastal sites from 2018–2022 and in five decadal or quasi-decadal periods and the
                  most recent value for each site, the year of that observation, and its percentage contribution to the total of the most recent values. The
                  decade of observation is colour-coded and the percentage contribution of values from different decades to the sum of the most recent
                  values is indicated. Numbers at subsites of Swartkops River and Lake St Lucia are shown in red and summed under those sites. Sites
                  that qualify as IBAs are highlighted in grey. Note that numbers breeding at inland sites were not available after 1990
                  Decade of most recent   1970s  1980s  1990s  2000s  2010s/20s  IBA on basis of ≥ 10 pairs
                  estimate
                                     Maximum breeding pairs observed                 % of sum of most recent estimates from different
                                                                                                decades
                                   Cooper   Kemper             Most   Year of   % of sum   60s/70s  1980s  1990s  2000s  10s/20s
                                                       This
                    Site            et al.   et al.   AEWA  study  recent   most   of most   1.26  0.00  0.00  41.06  57.68
                                                                             recent
                                                                      recent
                                   (1992)  (2007)  (2015)     estimate   estimate  estimates  Maximum observed pairs in different decades
                                                              (pairs)
                                    1980-  1995-       2018-
                                                                                     1970s  1980s  1990s  2000s  2010s
                                    1991   2006        2022
                  Coastal sites
                  Angola
                  Ilha dos Tigres           88    88           88     2005   22.17                      88
                  Namibia
                  Mile 4 Saltworks,   40    18    18    51      1     2021    0.25    35    40                51
                  Swakopmund
                  Pelican Point                                 4     1964    1.01
                  Walvis Bay sewage works     2    2            2     2014    0.50    6                        2
                  Walvis Bay Saltworks                         75     2004   18.89                      48
                  Sandwich Harbour          1      1            1     1977    0.25    1
                  Seal Island                            1      1     2022    0.25                             1
                  Penguin Island                         1      1     2022    0.25                             1
                  Possession Island                      4      2     2022    0.50                             4
                  South Africa
                  Orange River estuary  12               0      0     2018    0.00          12                 0
                  Alexander Bay sewage   2               0      0     2019    0.00          2                  0
                  works
                  Tweepad (Slimes Dam)  1                1      0     2019    0.00                1            1
                  Velddrif saltworks                    17     17     2017    4.28                      51    85
                  Lower Berg River   32           69    55     21     2020    5.29    15    32    30    0     55
                  Malgas Island                          1      0     2020    0.00                             1
                  Marcus Island                          0      0     2020    0.00    1                        0
                  Jutten Island      1      2      1     1      0     2020    0.00          1           1      2
                  Meeuw Island              1      1     1      0     2020    0.00                2     1      1
                  Schaapen Island    5      1      1     2      1     2020    0.25    20          5     1      2
                  Vondeling Island                       0      0     2019    0.00                      1      0
                  Caspian Island     5      12          10      8     2018    2.02          5     15    25    15
                  Die Skeiding, Yzerfontein              0      0     2021    0.00                             1
                  Dassen Island                          0      0     2021    0.00                      0      1
                  Robben Island                    1     1      0     2019    0.00                      0      1
                  Strandfontein Sewerage   1             0      0     2020    0.00          1                  0
                  Works
                  Dyer Island        1                  15     15     2020    3.78          1           4      0
                  Die Dam            12                  0      0     2019    0.00          12                21
                  Heuningnes River, De
                  Mond                            35     0      0     2018    0.00          2           35     5
                  De Hoop Vlei                           0      0     2018    0.00                             4
                  Knysna Lagoon                                 2     2004    0.50
                  Keurbooms River estuary  2       3     1      1     2021    0.25    2     2           3
                  Swartkops River Saltpans  52     18    0      0     2021    0.00          58    50    47    42
                  Bar None Saltpans                      0      0     2021                                    40
                  Chatty Saltpans                        0      0     2021                              47


                                                                 540