
Page 585 - Atlas Sea Birds Ver1
P. 585
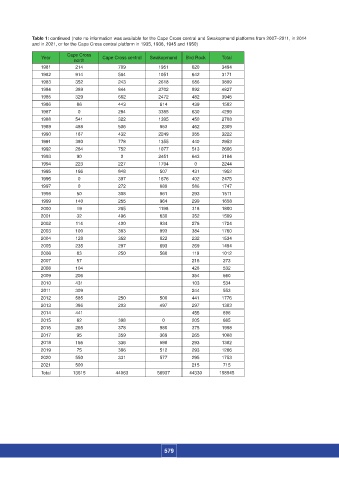
Table 1: continued (note no information was available for the Cape Cross central and Swakopmund platforms from 2007–2011, in 2014
                  and in 2021, or for the Cape Cross central platform in 1935, 1936, 1945 and 1950)
                               Cape Cross
                     Year                  Cape Cross central  Swakopmund  Bird Rock  Total
                                 north
                     1981        214            709            1951       620        3494
                     1982        914            564            1051       642        3171
                     1983        352            243            2618       686        3899
                     1984        389            844            2702       892        4827
                     1985        329            662            2472       482        3945
                     1986         86            443            614        439        1582
                     1987         0             284            3385       630        4299
                     1988        541            322            1395       450        2708
                     1989        488            506            853        462        2309
                     1990        187            432            2249       355        3222
                     1991        380            778            1355       440        2953
                     1992        264            752            1077       513        2606
                     1993         90             0             2451       643        3184
                     1994        223            227            1794        0         2244
                     1995        166            848            507        431        1952
                     1996         0             397            1676       402        2475
                     1997         0             272            889        586        1747
                     1998         50            308            861        293        1511
                     1999        140            255            964        299        1658
                     2000         19            265            1198       318        1800
                     2001         32            496            630        352        1509
                     2002         114           400            934        276        1724
                     2003        100            383            893        384        1760
                     2004        128            352            822        232        1534
                     2005        235            297            693        269        1494
                     2006         83            250            560        119        1012
                     2007         57                                      216        273
                     2008        104                                      428        532
                     2009        206                                      354        560
                     2010        431                                      103        534
                     2011        309                                      244        553
                     2012        585            250            500        441        1776
                     2013        386            203            497        297        1383
                     2014        441                                      455        896
                     2015         62            398             0         205        665
                     2016        265            378            980        375        1998
                     2017         95            359            369        265        1088
                     2018        155            336            598        293        1382
                     2019         75            386            512        293        1266
                     2020        550            331            577        295        1753
                     2021        500                                      215        715
                     Total       13615          44063         56937      44330      158945


                                                                 579