
Page 14 - Real Estate_Capabilities (US) Book
P. 14
Customized Analytics for
Data Driven Decisions
One of the most important things HUB can do for our clients is to help them determine and
deploy the optimal program structure for each of their insurable risks individually and/or all of
them collectively.
Client Analytics is a resource to HUB brokers and their clients, offering a variety of tools that
provide quantitative decision-support for insurance program design and implementation.
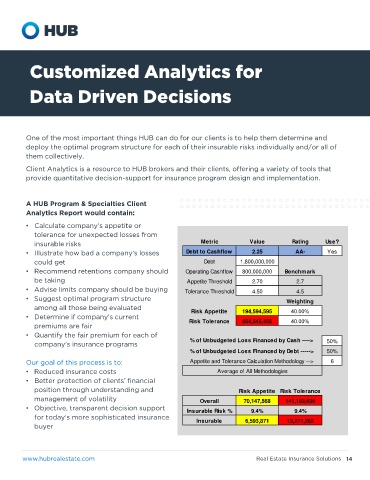
A HUB Program & Specialties Client
Analytics Report would contain:
•
tolerance for unexpected losses from
Metric Value Rating Use? insurable risks Value Rating Use? Metric Value Rating Use?
Metric
Days Cash on Hand 250.0 AA- Yes • Operating Margin 7.50% AA+ Yes Debt to Cashflow 2.25 AA- Yes
Revenues
Cash on Hand 125,000,000 could get 2,500,000,000 Debt 1,800,000,000
Daily Cash Need 500,000 Benchmark • Recommend retentions company should Operating Cashflow 800,000,000 Benchmark
Benchmark
Operating Income
187,500,000
be taking
Appetite Threshold 208.0 208.0 Appetite Threshold 3.00% 3.0% Appetite Threshold 2.70 2.7
Tolerance Threshold
Tolerance Threshold 156.0 156.0 • Advise limits company should be buying Tolerance Threshold 4.50 4.5
2.60%
2.6%
Weighting • Suggest optimal program structure Weighting
Weighting
among all those being evaluated
Risk Appetite 42,000,000 40.00% Risk Appetite 112,500,000 0.00% Risk Appetite 194,594,595 40.00%
•
Risk Tolerance 94,000,000 40.00% Risk Tolerance 122,500,000 0.00% Risk Tolerance 654,545,455 40.00%
premiums are fair
• Quantify the fair premium for each of
Metric Value Rating Use? Metric Value Rating Use? % of Unbudgeted Loss Financed by Cash ----> 50%
Current Ratio 2.22 A+ Yes EBIDA Margin 12.00% AA- Yes % of Unbudgeted Loss Financed by Debt -----> 50%
Revenues
Current Assets 1,000,000,000 Our goal of this process is to: Appetite and Tolerance Calculation Methodology --> 6
2,500,000,000
EBIDA
Current Liabilities 450,000,000 Benchmark • Reduced insurance costs Benchmark Average of All Methodologies
300,000,000
Appetite Threshold 2.00 2.0 • Appetite Threshold 11.20% 11.2%
position through understanding and
Tolerance Threshold 1.50 1.5 Tolerance Threshold 9.80% 9.8% Risk Appetite Risk Tolerance
Weighting management of volatility Weighting Overall 70,147,568 141,183,636
• Objective, transparent decision support
Risk Appetite 200,000,000 10.00% Risk Appetite 20,000,000 10.00% Insurable Risk % 9.4% 9.4%
Risk Tolerance 650,000,000 10.00% Risk Tolerance 55,000,000 10.00% Insurable 6,593,871 13,271,262
buyer
www.hubrealestate.com Real Estate Insurance Solutions 14