
Page 358 - Corporate Finance PDF Final new link
P. 358
358 Corporate Finance BRILLIANT’S
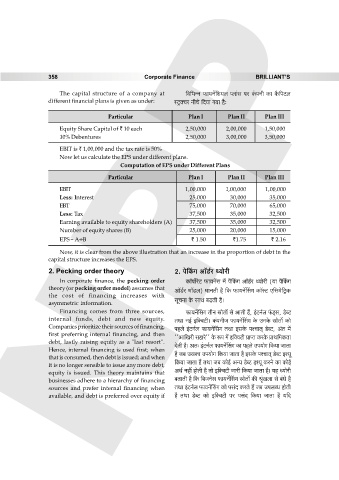
The capital structure of a company at {d{^ÝZ ’$m¶Z|{e¶b ßbm§g na H§$nZr H$m H¡${nQ>b
different financial plans is given as under: ñQ´>³Ma ZrMo {X¶m J¶m h¡…
Particular Plan I Plan II Plan III
Equity Share Capital of ` 10 each 2,50,000 2,00,000 1,50,000
10% Debentures 2,50,000 3,00,000 3,50,000
EBIT is ` 1,00,000 and the tax rate is 50%
Now let us calculate the EPS under different plans.
Computation of EPS under Different Plans
Particular Plan I Plan II Plan III
EBIT 1,00,000 1,00,000 1,00,000
Less: Interest 25,000 30,000 35,000
EBT 75,000 70,000 65,000
Less: Tax NPP 37,500 35,000 32,500
Earning available to equity shareholders (A) 37,500 35,000 32,500
Number of equity shares (B) 25,000 20,000 15,000
EPS = AB ` 1.50 `1.75 ` 2.16
Now, it is clear from the above illustration that an increase in the proportion of debt in the
capital structure increases the EPS.
2. Pecking order theory 2. noqH$J Am°S>©a ϶moar
In corporate finance, the pecking order H$m°nmo©aoQ> ’$m¶Z|g ‘| n¡qH$J Am°S>©a ϶moar (¶m n¡qH$J
theory (or pecking order model) assumes that Am°S>©a ‘m°S>b) ‘mZVr h¡ {H$ ’$m¶Z|qgJ H$m°ñQ> E{g‘o{Q´>H$
the cost of financing increases with
asymmetric information. gyMZm Ho$ gmW ~‹T>Vr h¡&
Financing comes from three sources, ’$m¶Z|qgJ VrZ òmoVm| go AmVr h¢, B§Q>Z©b ’§$S²>g, S>oãQ>
internal funds, debt and new equity. VWm ZB© B{³dQ>r& H$§nZrO ’$m¶Z|qgJ Ho$ CZHo$ òmoVm| H$mo
Companies prioritize their sources of financing, nhbo B§Q>Z©b ’$m¶Z|qgJ VWm BgHo$ níMmV² S>oãQ>, A§V ‘|
first preferring internal financing, and then
''Am{Iar ghmao'' Ho$ ê$n ‘| B{³dQ>r àmßV H$aHo$ àmW{‘H$Vm
debt, lastly raising equity as a "last resort". XoVr h¡& AV… B§Q>Z©b ’$m¶Z|qgJ H$m nhbo Cn¶moJ {H$¶m OmVm
Hence, internal financing is used first; when h¡ O~ CgH$m Cn¶moJ {H$¶m OmVm h¡ BgHo$ níMmV² S>oãQ> Bí¶y
that is consumed, then debt is issued; and when
it is no longer sensible to issue any more debt, {H$¶m OmVm h¢ VWm O~ H$moB© Aݶ S>oãQ> Bí¶y H$aZo H$m H$moB©
equity is issued. This theory maintains that AW© Zht hmoVr h¡ Vmo B{³dQ>r Omar {H$¶m OmVm h¡& ¶h ϶moar
businesses adhere to a hierarchy of financing ~VmVr h¡ {H$ {~OZog ’$m¶Z|qgJ òmoVm| H$s l¥§Ibm go ~§Yo h¡
sources and prefer internal financing when VWm B§Q>Z©b ’$m¶Z|qgJ H$mo ng§X H$aVo h¢ O~ CnbãY hmoVr
available, and debt is preferred over equity if h¡ VWm S>oãQ> H$mo B{³dQ>r na ng§X {H$¶m OmVm h¡ ¶{X