
Page 82 - Book Funnels & Amazon Ads
P. 82
BOOK FUNNELS & AMAZON ADS
With the exception of excessive spend, it’s okay to shut off until enough time passes for Amazon to log any sales that might have resulted from it.
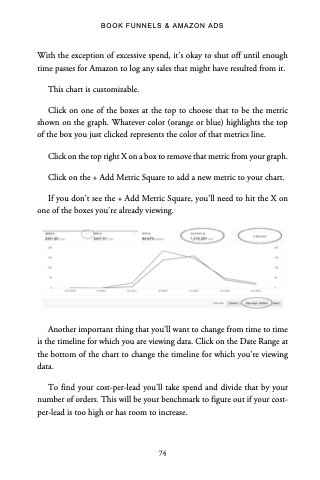
This chart is customizable.
Click on one of the boxes at the top to choose that to be the metric shown on the graph. Whatever color (orange or blue) highlights the top of the box you just clicked represents the color of that metrics line.
Click on the top right X on a box to remove that metric from your graph.
Click on the + Add Metric Square to add a new metric to your chart.
If you don’t see the + Add Metric Square, you’ll need to hit the X on one of the boxes you’re already viewing.
Another important thing that you’ll want to change from time to time is the timeline for which you are viewing data. Click on the Date Range at the bottom of the chart to change the timeline for which you’re viewing data.
To find your cost-per-lead you’ll take spend and divide that by your number of orders. This will be your benchmark to figure out if your cost- per-lead is too high or has room to increase.
74
