
Page 59 - Organizational Project Management
P. 59
Chapter 6—The OPM3 Cycle
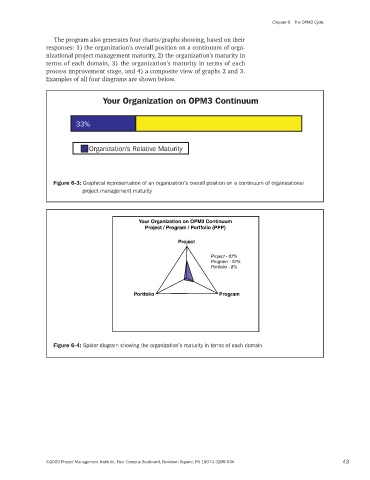
The program also generates four charts/graphs showing, based on their
responses: 1) the organization’s overall position on a continuum of orga-
nizational project management maturity, 2) the organization’s maturity in
terms of each domain, 3) the organization’s maturity in terms of each
process improvement stage, and 4) a composite view of graphs 2 and 3.
Examples of all four diagrams are shown below.
Your Organization on OPM3 Continuum
33%
Organization's Relative Maturity
Figure 6-3: Graphical representation of an organization’s overall position on a continuum of organizational
project management maturity
Your Organization on OPM3 Continuum
Project / Program / Portfolio (PPP)
Project
Project - 57%
Program - 22%
Portfolio - 8%
Portfolio Program
Figure 6-4: Spider diagram showing the organization’s maturity in terms of each domain
©2003 Project Management Institute, Four Campus Boulevard, Newtown Square, PA 19073-3299 USA 43