Page 60 - Organizational Project Management
P. 60

Chapter 6—The OPM3 Cycle


                                                 Your Organization on OPM3 Continuum
                                                Standardize / Measure / Control / Improve
                                                             (SMCI)
                                                          Standardize
                                                                       Standardize - 39%
                                                                       Measure - 21%
                                                                       Control - 15%
                                                                       Improve - 26%
                                              Improve                    Measure
                                                                                                                                                                                                        Best
                                                                                                                                         Practices Directory

                                                            Control


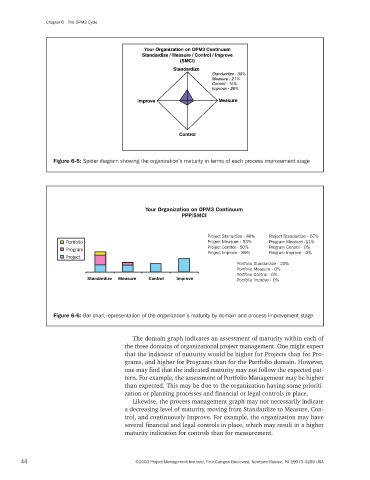
                   Figure 6-5: Spider diagram showing the organization’s maturity in terms of each process improvement stage


                                                                                                                                                   Improvement Planning Directory

                                                 Your Organization on OPM3 Continuum
                                                             PPP/SMCI


                                                                      Project Stanardize - 48%   Project Standardize - 67%
                       Portfolio                                      Project Measure - 53%   Program Measure -11%
                                                                      Project Control - 50%   Program Control - 0%
                       Program
                                                                      Project Improve - 89%   Program Improve - 0%
                       Project
                                                                               Portfolio Standardize - 20%
                                                                               Portfolio Measure - 0%
                                                                               Portfolio Control - 0%
                              Standardize  Measure  Control  Improve           Portfolio Improve - 0%


                                                                                                                                                                                                 Capabilities
                   Figure 6-6: Bar chart representation of the organization’s maturity by domain and process improvement stage           Directory


                                             The domain graph indicates an assessment of maturity within each of
                                          the three domains of organizational project management. One might expect
                                          that the indicator of maturity would be higher for Projects than for Pro-
                                          grams, and higher for Programs than for the Portfolio domain. However,                                     Capabilities Directory
                                          one may find that the indicated maturity may not follow the expected pat-
                                          tern. For example, the assessment of Portfolio Management may be higher
                                          than expected. This may be due to the organization having some prioriti-
                                          zation or planning processes and financial or legal controls in place.
                                             Likewise, the process management graph may not necessarily indicate
                                          a decreasing level of maturity, moving from Standardize to Measure, Con-
                                          trol, and continuously Improve. For example, the organization may have
                                          several financial and legal controls in place, which may result in a higher
                                          maturity indication for controls than for measurement.


        44                                    ©2003 Project Management Institute, Four Campus Boulevard, Newtown Square, PA 19073-3299 USA
   55   56   57   58   59   60   61   62   63   64   65