
Page 331 - Area 2 Para E
P. 331
Turkish Journal of Computer and Mathematics Education Vol.12 No.10 (2021), 4211-4222
Research Article
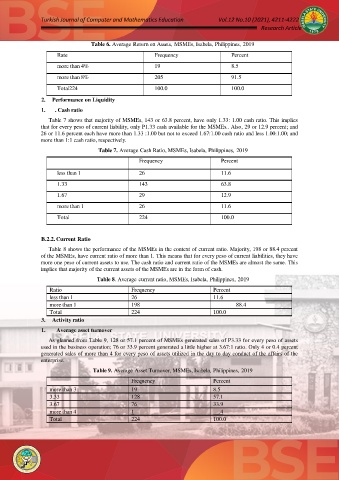
Table 6. Average Return on Assets, MSMEs, Isabela, Philippines, 2019
Rate Frequency Percent
more than 4% 19 8.5
more than 8% 205 91.5
Total224 100.0 100.0
2. Performance on Liquidity
1. . Cash ratio
Table 7 shows that majority of MSMEs, 143 or 63.8 percent, have only 1.33: 1.00 cash ratio. This implies
that for every peso of current liability, only P1.33 cash available for the MSMEs.. Also, 29 or 12.9 percent; and
26 or 11.6 percent each have more than 1.33 :1.00 but not to exceed 1.67:1.00 cash ratio and less 1.00:1.00; and
more than 1:1 cash ratio, respectively.
Table 7. Average Cash Ratio, MSMEs, Isabela, Philippines, 2019
Frequency Percent
less than 1 26 11.6
1.33 143 63.8
1.67 29 12.9
more than 1 26 11.6
Total 224 100.0
B.2.2. Current Ratio
Table 8 shows the performance of the MSMEs in the context of current ratio. Majority, 198 or 88.4 percent
of the MSMEs, have current ratio of more than 1. This means that for every peso of current liabilities, they have
more one peso of current assets to use. The cash ratio and current ratio of the MSMEs are almost the same. This
implies that majority of the current assets of the MSMEs are in the form of cash.
Table 8. Average current ratio, MSMEs, Isabela, Philippines, 2019
Ratio Frequency Percent
less than 1 26 11.6
more than 1 198 88.4
Total 224 100.0
3. Activity ratio
1. Average asset turnover
As gleaned from Table 9, 128 or 57.1 percent of MSMEs generated sales of P3.33 for every peso of assets
used in the business operation; 76 or 33.9 percent generated a little higher at 3.67:1 ratio. Only 4 or 0.4 percent
generated sales of more than 4 for every peso of assets utilized in the day to day conduct of the affairs of the
enterprise.
Table 9. Average Asset Turnover, MSMEs, Isabela, Philippines, 2019
Frequency Percent
more than 3 19 8.5
3.33 128 57.1
3.67 76 33.9
more than 4 1 .4
Total 224 100.0