
Page 332 - Area 2 Para E
P. 332
Turkish Journal of Computer and Mathematics Education Vol.12 No.10 (2021), 4211-4222
Research Article
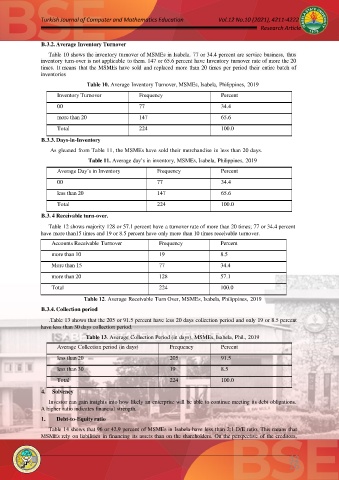
B.3.2. Average Inventory Turnover
Table 10 shows the inventory turnover of MSMEs in Isabela. 77 or 34.4 percent are service business, thus
inventory turn-over is not applicable to them. 147 or 65.6 percent have Inventory turnover rate of more the 20
times. It means that the MSMEs have sold and replaced more than 20 times per period their entire batch of
inventories
Table 10. Average Inventory Turnover, MSMEs, Isabela, Philippines, 2019
Inventory Turnover Frequency Percent
00 77 34.4
more than 20 147 65.6
Total 224 100.0
B.3.3. Days-in-Inventory
As gleaned from Table 11, the MSMEs have sold their merchandise in less than 20 days.
Table 11. Average day’s in inventory, MSMEs, Isabela, Philippines, 2019
Average Day’s in Inventory Frequency Percent
00 77 34.4
less than 20 147 65.6
Total 224 100.0
B.3. 4 Receivable turn-over.
Table 12 shows majority 128 or 57.1 percent have a turnover rate of more than 20 times; 77 or 34.4 percent
have more than15 times and 19 or 8.5 percent have only more than 10 times receivable turnover.
Accounts Receivable Turnover Frequency Percent
more than 10 19 8.5
More than 15 77 34.4
more than 20 128 57.1
Total 224 100.0
Table 12. Average Receivable Turn Over, MSMEs, Isabela, Philippines, 2019
B.3.4. Collection period
.Table 13 shows that the 205 or 91.5 percent have less 20 days collection period and only 19 or 8.5 percent
have less than 30 days collection period.
Table 13. Average Collection Period (in days), MSMEs, Isabela, Phil., 2019
Average Collection period (in days) Frequency Percent
less than 20 205 91.5
less than 30 19 8.5
Total 224 100.0
4. Solvency
Investor can gain insights into how likely an enterprise will be able to continue meeting its debt obligations.
A higher ratio indicates financial strength.
1. Debt-to-Equity ratio
Table 14 shows that 96 or 42.9 percent of MSMEs in Isabela have less than 2:1 D/E ratio. This means that
MSMEs rely on liabilities in financing its assets than on the shareholders. On the perspective of the creditors,
42
16