
Page 162 - C:\Users\uromn\Videos\seyyedi pdf\
P. 162
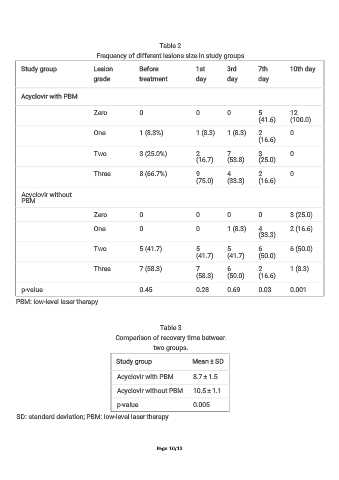
Table 2
                                    Frequency of different lesions size in study groups

         Study group               Lesion          Before               1st        3rd        7th         10th day
                                   grade           treatment            day        day        day


         Acyclovir with PBM


                                   Zero            0                    0          0          5           12
                                                                                              (41.6)      (100.0)

                                   One             1 (8.3%)             1 (8.3)    1 (8.3)    2           0
                                                                                              (16.6)

                                   Two             3 (25.0%)            2          7          3           0
                                                                        (16.7)     (53.8)     (25.0)


                                   Three           8 (66.7%)            9          4          2           0
                                                                        (75.0)     (33.3)     (16.6)

         Acyclovir without
         PBM

                                   Zero            0                    0          0          0           3 (25.0)

                                   One             0                    0          1 (8.3)    4           2 (16.6)
                                                                                              (33.3)

                                   Two             5 (41.7)             5          5          6           6 (50.0)
                                                                        (41.7)     (41.7)     (50.0)

                                   Three           7 (58.3)             7          6          2           1 (8.3)
                                                                        (58.3)     (50.0)     (16.6)

         p-value                                   0.45                 0.28       0.69       0.03        0.001
       PBM: low-level laser therapy


                                                          Table 3

                                          Comparison of recovery time between
                                                        two groups.

                                           Study group                Mean ± SD


                                           Acyclovir with PBM         8.7 ± 1.5

                                           Acyclovir without PBM      10.5 ± 1.1

                                           p-value                    0.005
       SD: standard deviation; PBM: low-level laser therapy


                                                         Page 10/13