
Page 163 - C:\Users\uromn\Videos\seyyedi pdf\
P. 163
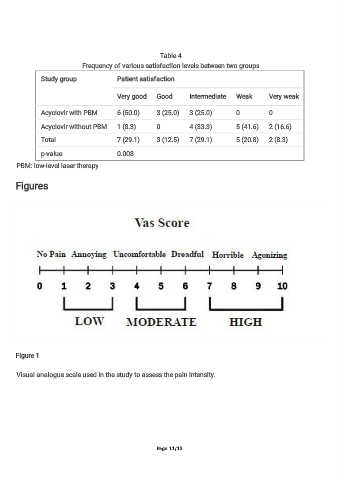
Table 4
                              Frequency of various satisfaction levels between two groups

                Study group                Patient satisfaction


                                           Very good     Good        Intermediate     Weak        Very weak


                Acyclovir with PBM         6 (50.0)      3 (25.0)    3 (25.0)         0           0

                Acyclovir without PBM      1 (8.3)       0           4 (33.3)         5 (41.6)    2 (16.6)

                Total                      7 (29.1)      3 (12.5)    7 (29.1)         5 (20.8)    2 (8.3)

                p-value                    0.008

       PBM: low-level laser therapy


       Figures


       Figure 1


       Visual analogue scale used in the study to assess the pain intensity.


                                                         Page 11/13