
Page 122 - Theoretical and Practical Interpretation of Investment Attractiveness
P. 122
(England), ABN AMRO (Netherlands), Bank of East Asia (Hong Kong) and HangSeng Bank
(Hong Kong). ensured that it came in.
During the world financial and economic crisis that began in 2008-2012, the Chinese
state implemented the "green corridor" system in order not to reduce the inflow of foreign
investments. From this system, the issues of registration of enterprises with foreign capital
and promotion of foreign investment are included, which, in turn, will act as a "protective
cushion" for investors.
Due to the implemented social-economic, legal-administrative and political-
organizational measures, China has become one of the dominant countries with the largest
trade in the next five years. In the reports published by UNCTAD, the PRC ranks among the
top two countries as a leader in capital import and export. In the pre-crisis period (2005-2007),
the export of foreign direct investments to China averaged 18.8 billion. amounted to US
dollars, which corresponded to 1.3% of the total world index (Foreign direct investment
exports). By 2019, China's share in the world's Foreign direct investment exports will be 8.9%,
with a value of 117 billion. amounted to US dollars.
In the same years, the import of Foreign direct investment (2005-2007) averaged 76.2
billion. to the US dollar (5.4% of the world volume), and in 2019 it was 141 billion. dollars
(9.15% of the world volume). In today's competitive environment between the US and China,
the difference between them remains significant. In 2019, the export capital in the USA was
125 billion. dollars (9.51% of the world volume), and the import volume is 246 billion dollars
(15.9% of the world volume).
If we add Hong Kong and Singapore, which are the "investment gateways" for the
People's Republic of China, to these statistics, this difference will decrease even more. In
2015, Hong Kong's GDP was 68.4 billion dollars, and Singapore's was 92 billion dolla rs,
respectively. amounted to a dollar.
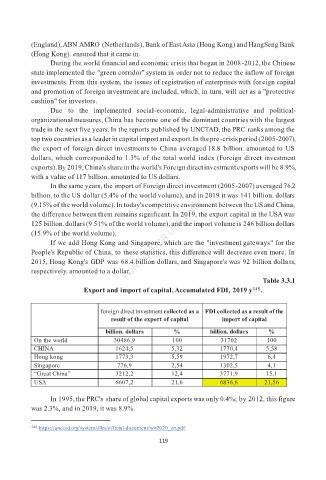
Table 3.3.1
Export and import of capital. Accumulated FDI, 2019 y 145 .
foreign direct investment collected as a FDI collected as a result of the
result of the export of capital import of capital
billion. dollars % billion. dollars %
On the world 30486,9 100 31702 100
CHINA 1624,5 5,32 1770,4 5,58
Hong kong 1773,3 5,59 1972,7 6,4
Singapore 776,9 2,54 1302,5 4,1
“Great China” 3212,2 12,4 3771,9 15,1
USA 6607,2 21,6 6836,6 21,56
In 1995, the PRC's share of global capital exports was only 0.4%; by 2012, this figure
was 2.3%, and in 2019, it was 8.9%.
145 https://unctad.org/system/files/official-document/wir2020_en.pdf
119