
Page 124 - Theoretical and Practical Interpretation of Investment Attractiveness
P. 124
volume growth and the growth of additional 44 percent of the jobs also had come to the same
state he had created it can be seen that on.
The ongoing projects in the year 2020 in the past year in a while in a planned manner
interruptions occur. The year 2019 also have a much better appearance than investment and
employment indicators, although in practice to lose their stability. The implementation of the
project COVID-19's effects would be really powerful in some countries. For example, the
foreign investment that have been a big part of common service centers, software
development or covering research developments in ireland, poland and portugal, such as
highly competitive, service-oriented countries, direct investment up to 80 percent of the
network project was saved. In this, the european region recorded on average 65% of the sales
level is much higher.
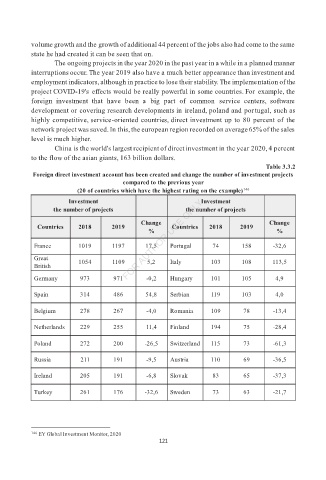
China is the world's largest recipient of direct investment in the year 2020, 4 percent
to the flow of the asian giants, 163 billion dollars.
Table 3.3.2
Foreign direct investment account has been created and change the number of investment projects
compared to the previous year
(20 of countries which have the highest rating on the example) 146
Investment Investment
the number of projects the number of projects
Change Change
Countries 2018 2019 Countries 2018 2019
% %
France 1019 1197 17,5 Portugal 74 158 -32,6
Great
1054 1109 5,2 Italy 103 108 113,5
British
Germany 973 971 -0,2 Hungary 101 105 4,9
Spain 314 486 54,8 Serbian 119 103 4,0
Belgium 278 267 -4,0 Romania 109 78 -13,4
Netherlands 229 255 11,4 Finland 194 75 -28,4
Poland 272 200 -26,5 Switzerland 115 73 -61,3
Russia 211 191 -9,5 Austria 110 69 -36,5
Ireland 205 191 -6,8 Slovak 83 65 -37,3
Turkey 261 176 -32,6 Sweden 73 63 -21,7
146 EY Global Investment Monitor, 2020
121