
Page 282 - Theoretical and Practical Interpretation of Investment Attractiveness
P. 282
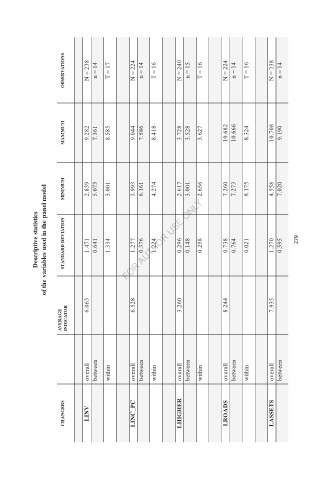
OBSERVATIONS      N = 238   n = 14   T = 17   N = 224   n = 14   T = 16   N = 240   n = 15   T = 16   N = 224   n = 14   T = 16   238  =  N  n = 14


                  MAXIMUM      9.282   7.361   8.585   9.044   7.586   8.418   3.728   3.528   3.627   10.682   10.666   8.324   10.708  9.190


                          2.839   5.073   3.001      3.993   6.161   4.274      2.617   3.001   2.656      7.260   7.273   8.175      4.558  7.020


                  MINIMUM


           Descriptive statistics  of the variables used in the panel model      STANDARD DEVIATION              1.471   0.641   1.334         1.277   0.376   1.224         0.296   0.148   0.258         0.738   0.764   0.021         1.270  0.595   279


                 AVERAGE   INDICATOR          6.063            6.528            3.260            8.244            7.935


                        overall   between   within   overall   between   within   overall   between   within   overall   between   within   overall  between


                  CHANGERS      LINV   LINC_PC   LHIGHER    LROADS      LASSETS