
Page 7 - Shore Chan DePumpo - Dallas CBD Market Overview
P. 7
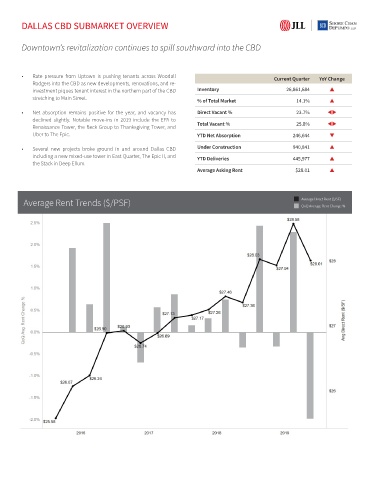
DALLAS CBD SUBMARKET OVERVIEW
Downtown’s revitalization continues to spill southward into the CBD
• Rate pressure from Uptown is pushing tenants across Woodall Current Quarter YoY Change
Rodgers into the CBD as new developments, renovations, and re-
investment piques tenant interest in the northern part of the CBD Inventory 26,861,684
stretching to Main Street. % of Total Market 14.1%
• Net absorption remains positive for the year, and vacancy has Direct Vacant % 23.7% tu
declined slightly. Notable move-ins in 2019 include the EPA to
Renaissance Tower, the Beck Group to Thanksgiving Tower, and Total Vacant % 25.8% tu
Uber to The Epic. YTD Net Absorption 246,644 q
• Several new projects broke ground in and around Dallas CBD Under Construction 940,841
including a new mixed-use tower in East Quarter, The Epic II, and YTD Deliveries 445,977
the Stack in Deep Ellum.
Average Asking Rent $28.01
Average Rent Trends ($/PSF) Average Direct Rent ($/SF)
QoQ Average Rent Change %