
Page 118 - JOJAPS_VOL13
P. 118
Isham Shah / JOJAPS – JOURNAL ONLINE JARINGAN PENGAJIAN SENI BINA
3.2 RESEARCH INSTRUMENT
The self-administered questionnaire was developed and adapted based on several variables derived from the framework of the
conceptual study using Google Form. The items in each dimension (independent and dependent variables) and scales used in
the exploratory stage. The items in each dimension were adapted from previous studies. A preliminary screening process was
carried out to select suitable candidate/respondent. The screening process based on the criteria was set by the researcher, to be
precise respondent should be 18 years or older and is familiar on the subject matters. Respondents who fulfilled the required
criteria could proceed with the questionnaire. Respondents have been briefed on the aims of the study before the questionnaire
was given. Collected data were analysed using responses summary through Google Form. Statistical methods such as
frequencies and cross-tabulation using races with all traditional food questions used to address the objective of the study.
4.0 RESULTS AND DISCUSSIONS
4.1 RESPONDENT PROFILE
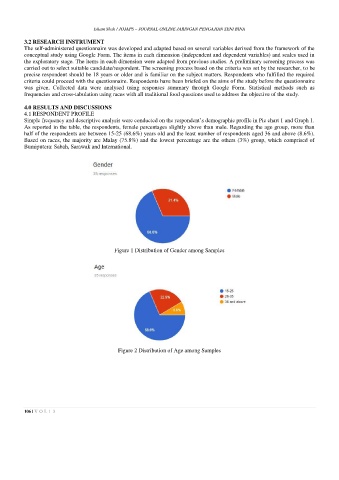
Simple frequency and descriptive analysis were conducted on the respondent’s demographic profile in Pie chart 1 and Graph 1.
As reported in the table, the respondents, female percentages slightly above than male. Regarding the age group, more than
half of the respondents are between 15-25 (68.6%) years old and the least number of respondents aged 36 and above (8.6%).
Based on races, the majority are Malay (75.8%) and the lowest percentage are the others (3%) group, which comprised of
Bumiputera: Sabah, Sarawak and International.
Figure 1 Distribution of Gender among Samples
Figure 2 Distribution of Age among Samples
106 | V O L 1 3