
Page 119 - JOJAPS_VOL13
P. 119
Isham Shah / JOJAPS – JOURNAL ONLINE JARINGAN PENGAJIAN SENI BINA
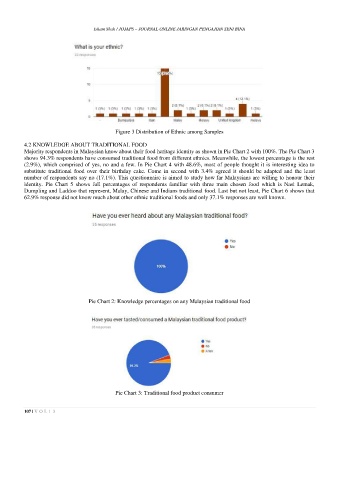
Figure 3 Distribution of Ethnic among Samples
4.2 KNOWLEDGE ABOUT TRADITIONAL FOOD
Majority respondents in Malaysian know about their food heritage identity as shown in Pie Chart 2 with 100%. The Pie Chart 3
shows 94.3% respondents have consumed traditional food from different ethnics. Meanwhile, the lowest percentage is the rest
(2.9%), which comprised of yes, no and a few. In Pie Chart 4 with 48.6%, most of people thought it is interesting idea to
substitute traditional food over their birthday cake. Come in second with 3.4% agreed it should be adapted and the least
number of respondents say no (17.1%). This questionnaire is aimed to study how far Malaysians are willing to honour their
identity. Pie Chart 5 shows full percentages of respondents familiar with three main chosen food which is Nasi Lemak,
Dumpling and Laddoo that represent, Malay, Chinese and Indians traditional food. Last but not least, Pie Chart 6 shows that
62.9% response did not know much about other ethnic traditional foods and only 37.1% responses are well known.
Pie Chart 2: Knowledge percentages on any Malaysian traditional food
Pie Chart 3: Traditional food product consumer
107 | V O L 1 3