
Page 119 - JOJAPS_VOL15
P. 119
JOURNAL ONLINE JARINGAN PENGAJIAN SENI BINA
If R count> Rtabble then the value of the statement is invalid
4.4 Reliability Test Results
Reliability testing is done to test the consistency of the measuring instrument, whether it is the result of
a consistency determination if the measurement is repeated. The reliability test used in this study uses Cronbach's
Alpha.
Table 4.4 Reliability Test Results
Cronbach’s N of Items
Alpha
,927 13
Source: Primary Data (2019, data processed)
If Rhitung> Rtabel, then the value of the statement is reliable.
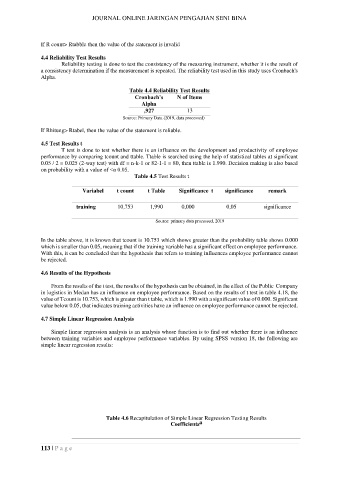
4.5 Test Results t
T test is done to test whether there is an influence on the development and productivity of employee
performance by comparing tcount and ttable. Ttable is searched using the help of statistical tables at significant
0.05 / 2 = 0.025 (2-way test) with df = n-k-1 or 82-1-1 = 80, then ttable is 1.990. Decision making is also based
on probability with a value of <α 0.05.
Table 4.5 Test Results t
Variabel t count t Table Significance t significance remark
training 10,753 1,990 0,000 0,05 significance
Source: primary data processed, 2019
In the table above, it is known that tcount is 10.753 which shows greater than the probability table shows 0.000
which is smaller than 0.05, meaning that if the training variable has a significant effect on employee performance.
With this, it can be concluded that the hypothesis that refers to training influences employee performance cannot
be rejected.
4.6 Results of the Hypothesis
From the results of the t test, the results of the hypothesis can be obtained, in the effect of the Public Company
in logistics in Medan has an influence on employee performance. Based on the results of t test in table 4.18, the
value of Tcount is 10.753, which is greater than t table, which is 1.990 with a significant value of 0.000. Significant
value below 0.05, that indicates training activities have an influence on employee performance cannot be rejected.
4.7 Simple Linear Regression Analysis
Simple linear regression analysis is an analysis whose function is to find out whether there is an influence
between training variables and employee performance variables. By using SPSS version 18, the following are
simple linear regression results:
Table 4.6 Recapitulation of Simple Linear Regression Testing Results
a
Coefficients
113 | P a g e