
Page 65 - JOJAPS_VOL15
P. 65
JOJAPS – JOURNAL ONLINE JARINGAN PENGAJIAN SENI BINA
To find out the value of the Degree of Freedom (Df) using the formula Df = n – 2. In this study, the value
of Df = 35 – 2 = 33
c. Determination of the values α
This research used a value of α = 5%
d. The determination of the value of r table through table r product moment
Through the tables r product moment, the value of r table on this research was 0.344.
Based on the steps that have been made, then the variable work environments, all grains are declared valid.
Reliability Test of Work Environment Variables (X1)
From the results of the calculations through the Software SPSS version 20, then it was gotten the value of reliability
for variable work environments (X1) was reliable and noted 0.752.
Reliability Test of Variable Work Discipline (X2)
From the results of the calculations through the Software SPSS version 20, then the value of variable for reliability
work disciplines (X2) was reliable and noted 0.752.
Reliability Test of Variables Employees’ Performance (Y)
From the results of the calculations through the Software SPSS version 20, then the value of variable for the
reliability of performance of the employees (Y) was reliable and noted 0.752.
Normality Test
Normality test was done through the data average kolmogorov – smirnor to all the variables by using the Software
SPSS version 20.
One-Sample Kolmogorov-Smirnov Test
Unstandardized
Residual
N 35
Mean 0E-7
a,b
Normal Parameters
Std. Deviation 3,16993203
Absolute ,066
Most Extreme Differences Positive ,048
Negative -,066
Kolmogorov-Smirnov Z ,389
Asymp. Sig. (2-tailed) ,998
a. Test distribution is Normal.
b. Calculated from data.
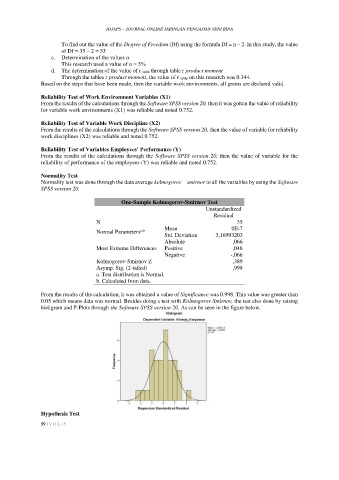
From the results of the calculation, it was obtained a value of Significance was 0.998. This value was greater than
0.05 which means data was normal. Besides doing a test with Kolmogorov Smirnov, the test also done by raising
histigram and P-Plots through the Software SPSS version 20. As can be seen in the figure below.
Hypothesis Test
59 | V O L 15