
Page 66 - JOJAPS_VOL15
P. 66
JOJAPS – JOURNAL ONLINE JARINGAN PENGAJIAN SENI BINA
The Correlation Analysis
Analysis of the correlation is the analysis to measure the degree of relationship between free variables with
variables bound. The result of correlation test is as follows:
a. Work Environment Variables (X1) has the significant value 0 < 0.05 and value of r count (0.745) > r table (0.344).
This means that there is a significant correlation between the variable work environments (X1) and employee
performance variables (Y).
b. Variable Work Discipline (X 2) has the significant value 0 < 0.05 and value of r count (0.832) > r table (0.344).
This means that there is a significant correlation between the variables work discipline (X 2) and performance
variables (Y).
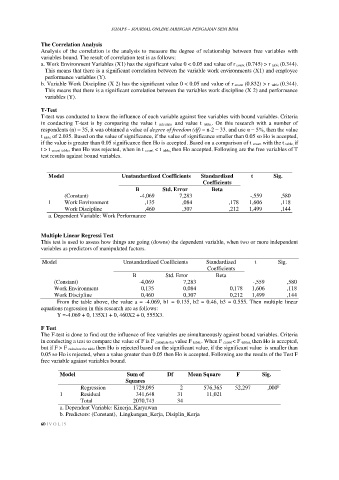
T-Test
T-test was conducted to know the influence of each variable against free variables with bound variables. Criteria
in conducting T-test is by comparing the value t calculate and value t table.. On this research with a number of
respondents (n) = 35, it was obtained a value of degree of freedom (df) = n-2 = 33. and use α = 5%, then the value
t table of 2.035. Based on the value of significance, if the value of significance smaller than 0.05 so Ho is accepted,
if the value is greater than 0.05 significance then Ho is accepted. Based on a comparison of t count with the t table, if
t > t count table, then Ho was rejected, when in t count < t table, then Ho accepted. Following are the free variables of T
test results against bound variables.
Model Unstandardized Coefficients Standardized t Sig.
Coefficients
B Std. Error Beta
(Constant) -4,069 7,283 -,559 ,580
1 Work Environment ,135 ,084 ,178 1,606 ,118
Work Discipline ,460 ,307 ,212 1,499 ,144
a. Dependent Variable: Work Performance
Multiple Linear Regressi Test
This test is used to assess how things are going (downs) the dependent variable, when two or more independent
variables as predictors of manipulated factors.
Model Unstandardized Coefficients Standardized t Sig.
Coefficients
B Std. Error Beta
(Constant) -4,069 7,283 -,559 ,580
Work Environment 0,135 0,084 0,178 1,606 ,118
Work Discipline 0,460 0,307 0,212 1,499 ,144
From the table above, the value a = -4.069, b1 = 0.135, b2 = 0.46, b3 = 0.555. Then multiple linear
equations regression in this research are as follows:
Y =-4.069 + 0, 135X1 + 0, 460X2 + 0, 555X3.
F Test
The F-test is done to find out the influence of free variables are simultaneously against bound variables. Criteria
in conducting a test to compare the value of F is F calculate the value F table.. When F count < F tables, then Ho is accepted,
but if F > F calculate the table then Ho is rejected based on the significant value, if the significant value is smaller than
0.05 so Ho is rejected, when a value greater than 0.05 then Ho is accepted. Following are the results of the Test F
free variable against variables bound.
Model Sum of Df Mean Square F Sig.
Squares
Regression 1729,095 2 576,365 52,297 ,000
b
1 Residual 341,648 31 11,021
Total 2070,743 34
a. Dependent Variable: Kinerja_Karyawan
b. Predictors: (Constant), Lingkungan_Kerja, Disiplin_Kerja
60 | V O L 15