
Page 96 - JOJAPS_VOL15
P. 96
MayangMurni / JOJAPS – JOURNAL ONLINE JARINGAN PENGAJIAN SENI BINA
p47). Data analysis methods in this study used descriptive statistics, multiple regression and Path analysis.
Systematically the study examines the effect of the independent variable (X) on the dependent variable (Y)
through the intervening variable (Z). Models in this research:
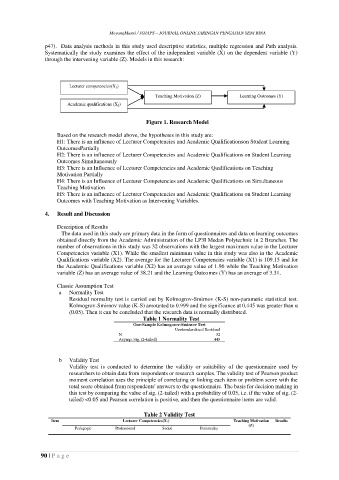
Lecturer competencies(X 1)
Teaching Motivation (Z) Learning Outcomes (Y)
Academic qualifications (X 2)
Figure 1. Research Model
Based on the research model above, the hypotheses in this study are:
H1: There is an influence of Lecturer Competencies and Academic Qualificationson Student Learning
OutcomesPartially
H2: There is an influence of Lecturer Competencies and Academic Qualifications on Student Learning
Outcomes Simultaneously
H3: There is an Influence of Lecturer Competencies and Academic Qualifications on Teaching
Motivation Partially
H4: There is an Influence of Lecturer Competencies and Academic Qualifications on Simultaneous
Teaching Motivation
H5: There is an influence of Lecturer Competencies and Academic Qualifications on Student Learning
Outcomes with Teaching Motivation as Intervening Variables.
4. Result and Discussion
Description of Results
The data used in this study are primary data in the form of questionnaires and data on learning outcomes
obtained directly from the Academic Administration of the LP3I Medan Polytechnic in 2 Branches. The
number of observations in this study was 32 observations with the largest maximum value in the Lecturer
Competencies variable (X1). While the smallest minimum value in this study was also in the Academic
Qualifications variable (X2). The average for the Lecturer Competencies variable (X1) is 109.15 and for
the Academic Qualifications variable (X2) has an average value of 1.96 while the Teaching Motivation
variable (Z) has an average value of 38.21 and the Learning Outcomes (Y) has an average of 3.31.
Classic Assumption Test
a Normality Test
Residual normality test is carried out by Kolmogrov-Smirnov (K-S) non-parametic statistical test.
Kolmogrov-Smirnov value (K-S) amounted to 0.999 and the significance at 0.445 was greater than α
(0.05). Then it can be concluded that the research data is normally distributed.
Table 1 Normality Test
One-Sample Kolmogorov-Smirnov Test
Unstandardized Residual
N 32
Asymp. Sig. (2-tailed) .445
b Validity Test
Validity test is conducted to determine the validity or suitability of the questionnaire used by
researchers to obtain data from respondents or research samples. The validity test of Pearson product
moment correlation uses the principle of correlating or linking each item or problem score with the
total score obtained from respondents' answers to the questionnaire. The basis for decision making in
this test by comparing the value of sig. (2-tailed) with a probability of 0.05, i.e. if the value of sig. (2-
tailed) <0.05 and Pearson correlation is positive, and then the questionnaire items are valid.
Table 2 Validity Test
Item Lecturer Competencies(X1) Teaching Motivation Results
(Z)
Pedagogic Professional Social Personality
90 | P a g e