
Page 97 - JOJAPS_VOL15
P. 97
MayangMurni / JOJAPS – JOURNAL ONLINE JARINGAN PENGAJIAN SENI BINA
Sig (2- Pearson Sig (2- Pearson Sig (2- Pearson Sig (2- Pearson Sig (2- Pearson
Tailed) Correlation Tailed) Correlation Tailed) Correlation Tailed) Correlation Tailed) Correlation
1 0,027 0,391 0,00 0,738 0,00 0,888 0,00 0,860 0,028 0,389 Valid
2 0,018 0,416 0,00 0,616 0,00 0,704 0,01 0,573 0,012 0,439 Valid
3 0,000 0,705 0,00 0,704 0,21 0,407 0,00 0,610 0,049 0,351 Valid
4 0,009 0,457 0,00 0,820 - - 0,00 0,710 0,000 0,659 Valid
5 0,000 0,660 0,00 0,906 - - 0,001 0,548 0,000 0,886 Valid
6 0,000 0,810 - - - - - - 0,003 0,503 Valid
7 0,002 0,534 - - - - - - 0,031 0,383 Valid
8 0,000 0,835 - - - - - - 0,001 0,556 Valid
9 0,000 0,700 - - - - - - 0,000 0,785 Valid
10 0,000 0,826 - - - - - - - - Valid
11 0,003 0,515 - - - - - - - - Valid
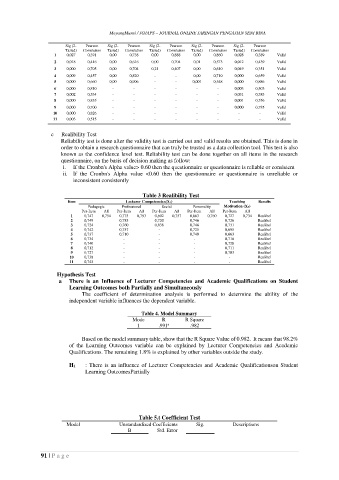
c Realibility Test
Reliability test is done after the validity test is carried out and valid results are obtained. This is done in
order to obtain a research questionnaire that can truly be trusted as a data collection tool. This test is also
known as the confidence level test. Reliability test can be done together on all items in the research
questionnaire, on the basis of decision making as follow:
i. If the Cronbn's Alpha value> 0.60 then the questionnaire or questionnaire is reliable or consistent
ii. If the Cronbn's Alpha value <0.60 then the questionnaire or questionnaire is unreliable or
inconsistent consistently
Table 3 Realibility Test
Item Lecturer Competencies(X1) Teaching Results
Pedagogic Professional Social Personality Motivation (X3)
Per-Item All Per-Item All Per-Item All Per-Item All Per-Item All
1 0,747 0,754 0,775 0,793 0,602 0,757 0,663 0,760 0,727 0,734 Realibel
2 0,749 0,783 0,720 0,746 0,726 Realibel
3 0,724 0,760 0,838 0,746 0,731 Realibel
4 0,742 0,757 - 0,725 0,695 Realibel
5 0,737 0,710 - 0,749 0,663 Realibel
6 0,734 - - - 0,716 Realibel
7 0,740 - - - 0,728 Realibel
8 0,712 - - - 0,711 Realibel
9 0,727 - - - 0,703 Realibel
10 0,738 - - - - Realibel
11 0,743 - - - - Realibel
Hypothesis Test
a There is an Influence of Lecturer Competencies and Academic Qualifications on Student
Learning Outcomes both Partially and Simultaneously
The coefficient of determination analysis is performed to determine the ability of the
independent variable influences the dependent variable.
Table 4. Model Summary
Mode R R Square
1 .991 a .982
Based on the model summary table, show that the R Square Value of 0.982. It means that 98.2%
of the Learning Outcomes variable can be explained by Lecturer Competencies and Academic
Qualifications. The remaining 1.8% is explained by other variables outside the study.
H1 : There is an influence of Lecturer Competencies and Academic Qualificationson Student
Learning OutcomesPartially
Table 5.t Coefficient Test
Model Unstandardized Coefficients Sig. Descriptions
B Std. Error
91 | P a g e