
Page 52 - J0JAPS_VOL14
P. 52
Mohd Sarhan / JOJAPS – JOURNAL ONLINE JARINGAN PENGAJIAN SENI BINA 0194955501
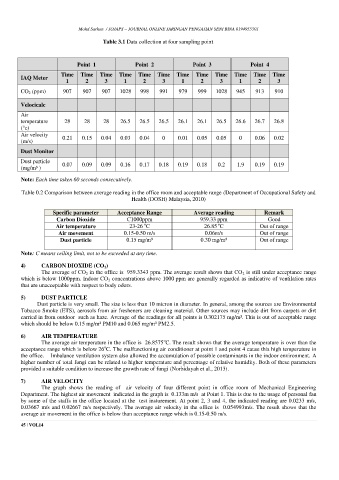
Table 3.1 Data collection at four sampling point
Point 1 Point 2 Point 3 Point 4
Time Time Time Time Time Time Time Time Time Time Time Time
IAQ Meter
1 2 3 1 2 3 1 2 3 1 2 3
CO 2 (ppm) 907 907 907 1028 998 991 979 999 1028 945 913 910
Velocicalc
Air
temperature 28 28 28 26.5 26.5 26.5 26.1 26.1 26.5 26.6 26.7 26.8
(°c)
Air velocity 0.21 0.15 0.04 0.03 0.04 0 0.01 0.05 0.05 0 0.06 0.02
(m/s)
Dust Monitor
Dust particle 0.07 0.09 0.09 0.16 0.17 0.18 0.19 0.18 0.2 1.9 0.19 0.19
(mg/m³ )
Note: Each time taken 60 seconds consecutively.
Table 0.2 Comparison between average reading in the office room and acceptable range (Department of Occupational Safety and
Health (DOSH) Malaysia, 2010)
Specific parameter Acceptance Range Average reading Remark
Carbon Dioxide C1000ppm 959.33 ppm Good
o
o
Air temperature 23-26 C 26.85 C Out of range
Air movement 0.15-0.50 m/s 0.06m/s Out of range
Dust particle 0.15 mg/m³ 0.30 mg/m³ Out of range
Note: C means ceiling limit, not to be exceeded at any time.
4) CARBON DIOXIDE (CO 2 )
The average of CO 2 in the office is 959.3343 ppm. The average result shows that CO 2 is still under acceptance range
which is below 1000ppm. Indoor CO 2 concentrations above 1000 ppm are generally regarded as indicative of ventilation rates
that are unacceptable with respect to body odors.
5) DUST PARTICLE
Dust particle is very small. The size is less than 10 micron in diameter. In general, among the sources are Environmental
Tobacco Smoke (ETS), aerosols from air fresheners are cleaning material. Other sources may include dirt from carpets or dirt
carried in from outdoor such as haze. Average of the readings for all points is 0.302175 mg/m³. This is out of acceptable range
which should be below 0.15 mg/m³ PM10 and 0.065 mg/m³ PM2.5.
6) AIR TEMPERATURE
o
The average air temperature in the office is 26.8575 C. The result shows that the average temperature is over than the
o
acceptance range which is below 26 C. The malfunctioning air conditioner at point 1 and point 4 cause this high temperature in
the office. Imbalance ventilation system also allowed the accumulation of possible contaminants in the indoor environment. A
higher number of total fungi can be related to higher temperature and percentage of relative humidity. Both of these parameters
provided a suitable condition to increase the growth rate of fungi (Norhidayah et al., 2013).
7) AIR VELOCITY
The graph shows the reading of air velocity of four different point in office room of Mechanical Engineering
Department. The highest air movement indicated in the graph is 0.133m m/s at Point 1. This is due to the usage of personal fan
by some of the staffs in the office located at the test insturement. At point 2, 3 and 4, the indicated reading are 0.0233 m/s,
0.03667 m/s and 0.02667 m/s respectively. The average air velocity in the office is 0.054993m/s. The result shows that the
average air movement in the office is below than acceptance range which is 0.15-0.50 m/s.
45 | VOL14