
Page 30 - JOJAPS_VOL15
P. 30
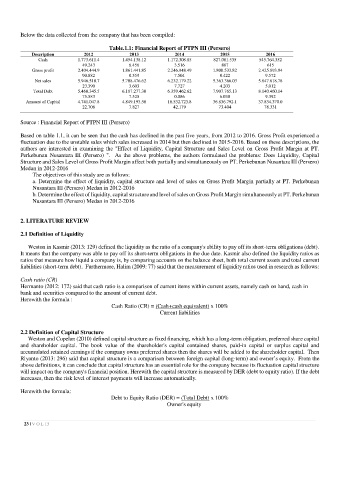
Below the data collected from the company that has been compiled:

                                       Table.1.1: Financial Report of PTPN III (Persero)
            Description        2012            2013           2014            2015            2016
               Cash         1.773.611.4     1.454.138.12    1.172.308.85    827.081.535     545.764.352
                              49.243          6.456           3.516            887             615
            Gross profit    2.404.444.9     1.861.441.85    2.246.948.49    1.800.533.82    2.425.893.94
                              90.882          0.559           7.504           8.422           9.572
             Net sales      5.946.518.7     5.708.476.62    6.232.179.22    5.363.366.03    5.847.818.78
                              23.390          3.603           7.727           4.203           5.012
             Total Debt     5.460.345.5     6.187.277.30    6.359.462.62    7.907.765.13    8.140.460.14
                              75.583          7.525           0.086           6.030           9.392
          Amount of Capital   4.741.047.8   4.849.193.58    18.532.723.8    36.836.792.1    37.834.370.0
                              22.708          7.827           42.179          73.404          78.331

        Source : Financial Report of PTPN III (Persero)

        Based on table 1.1, it can be seen that the cash has declined in the past five years, from 2012 to 2016. Gross Profit experienced a
        fluctuation due to the unstable sales which sales increased in 2014 but then declined in 2015-2016. Based on these descriptions, the
        authors are  interested  in  examining  the  "Effect  of  Liquidity,  Capital  Structure  and  Sales  Level  on  Gross  Profit  Margin at  PT.
        Perkebunan  Nusantara  III  (Persero)  ".  As  the  above  problems,  the  authors  formulated  the  problems:  Does  Liquidity,  Capital
        Structure and Sales Level of Gross Profit Margin affect both partially and simultaneously on PT. Perkebunan Nusantara III (Persero)
        Medan in 2012-2016
            The objectives of this study are as follows:
            a. Determine the effect of liquidity, capital structure and level of sales on Gross Profit Margin partially at PT. Perkebunan
            Nusantara III (Persero) Medan in 2012-2016
            b. Determine the effect of liquidity, capital structure and level of sales on Gross Profit Margin simultaneously at PT. Perkebunan
            Nusantara III (Persero) Medan in 2012-2016


        2. LITERATURE REVIEW

        2.1 Definition of Liquidity

           Weston in Kasmir (2013: 129) defined the liquidity as the ratio of a company's ability to pay off its short-term obligations (debt).
        It means that the company was able to pay off its short-term obligations in the due date. Kasmir also defined the liquidity ratios as
        ratios that measure how liquid a company is, by comparing accounts on the balance sheet, both total current assets and total current
        liabilities (short-term debt).  Furthermore, Halim (2009: 77) said that the measurement of liquidity ratios used in research as follows:

        Cash ratio (CR)
        Hermanto (2012: 172) said that cash ratio is a comparison of current items within current assets, namely cash on hand, cash in
        bank and securities compared to the amount of current debt.
        Herewith the formula :
                                        Cash Ratio (CR) = (Cash+cash equivalent) x 100%
                                                                Current liabilities


        2.2 Definition of Capital Structure
           Weston and Copelan (2010) defined capital structure as fixed financing, which has a long-term obligation, preferred share capital
        and  shareholder  capital.  The  book  value  of  the  shareholder's  capital  contained  shares,  paid-in  capital  or  surplus  capital  and
        accumulated retained earnings if the company owns preferred shares then the shares will be added to the shareholder capital.  Then
        Riyanto (2013: 296) said that capital structure is a comparison between foreign capital (long-term) and owner’s equity.  From the
        above definitions, it can conclude that capital structure has an essential role for the company because its fluctuation capital structure
        will impact on the company's financial position. Herewith the capital structure is measured by DER (debt to equity ratio). If the debt
        increases, then the risk level of interest payments will increase automatically.

        Herewith the formula:
                                        Debt to Equity Ratio (DER) = (Total Debt) x 100%
                                                             Owner's equity


           23 | V O L 15