
Page 23 - jojaps_vol14
P. 23
Data obtained from the study were analyzed using Statistical Packages for the Social Science (SPSS) version
23.0. Then, the achievement of both groups was analyzed by scale level as shown in Table 4 to obtain mean value
and standard deviation. The mean value between the two groups was compared to identify the effectiveness of
video use in teaching and learning. For questionnaire instrument, data analysis was done using min and standard
deviation obtained descriptively.
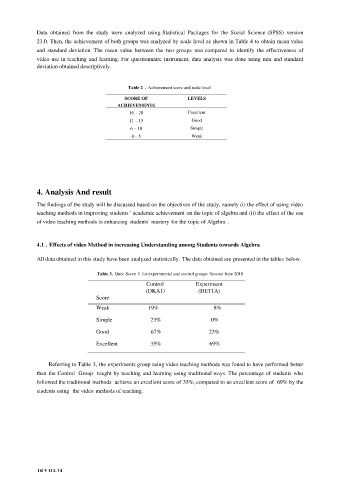
Table 2 . Achievement score and scale level
SCORE OF LEVELS
ACHIEVEMENTS
16 - 20 Excellent
11 - 15 Good
6 - 10 Simple
0 - 5 Weak
4. Analysis And result
The findings of the study will be discussed based on the objectives of the study, namely (i) the effect of using video
teaching methods in improving students ' academic achievement on the topic of algebra and (ii) the effect of the use
of video teaching methods in enhancing students' mastery for the topic of Algebra .
4.1 . Effects of video Method in increasing Understanding among Students towards Algebra
All data obtained in this study have been analyzed statistically. The data obtained are presented in the tables below.
Table 3. Quiz Score 1 for experimental and control groups Session June 2018
Control Experiment
(DKA1) (DET1A)
Score
Weak 19% 8%
Simple 23% 0%
Good 67% 23%
Excellent 35% 69%
Referring to Table 3, the experiments group using video teaching methods was found to have performed better
than the Control Group tought by teaching and learning using traditional ways. The percentage of students who
followed the traditional methods achieve an excellent score of 35%, compared to an excellent score of 69% by the
students using the video methods of teaching.
16| V O L 14