
Page 42 - PROOF_ENG
P. 42
40
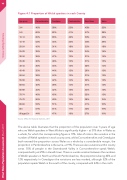
Figure 4:1 Proportion of Welsh speakers in each County
Age group
3-4
5-9
10-14 15-19 20-24 25-29 30-34 35-39 40-44 45-49 50-54 55-59 60-64 65-69 70-74 75-79 80-84
85+
All aged 3+
Carmarthenshire Ceredigion Pembrokeshire
46% 58% 22% 60% 82% 41% 60% 83% 46% 53% 45% 35% 42% 31% 18% 39% 49% 16% 36% 47% 13% 36% 48% 13% 36% 45% 13% 35% 44% 13%
38% 44% 13%
39% 42% 14%
40% 39% 14%
45% 42% 15%
46% 45% 15%
50% 49% 15% 53% 51% 17% 57% 51% 17% 44% 47% 19%
Source: Office for National Statistics, 2011
The above table illustrates that the proportion of the population over 3 years of age who are Welsh speakers in West Wales is significantly higher – at 37% than in Wales as a whole, for which the corresponding figure is 19%. Also of note is the variation in the number of Welsh speakers in each county area; whilst Carmarthenshire and Ceredigion both exceed the proportion across Wales as a whole by a considerable margin, the proportion in Pembrokeshire is the same, at 19%. There are also variations within county areas. 55% of people in the Gwendraeth Valley in Carmarthenshire speak Welsh, compared with just 25% in Llanelli town. There is a wide variation between the numbers of Welsh speakers in North and South Pembrokeshire, the proportions being 40% and 12% respectively. In Ceredigion the variations are less marked, although 52% of the population speak Welsh in the south of the county, compared with 44% in the north.
West Wales Population Assessment March 2017 Cross cutting themes
West Wales Wales
40% 23% 57% 38% 59% 42% 46% 29% 32% 18% 34% 16% 31% 15% 31% 15% 30% 14% 29% 13% 31% 13% 32% 13% 31% 13% 34% 15% 35% 15% 38% 16% 41% 18% 43% 19% 37% 19%
