
Page 412 - Physics Coursebook 2015 (A level)
P. 412
Cambridge International A Level Physics
400
In Figure 25.24, when the output of the op-amp is sufficiently positive relative to earth the green LED will light. When the output is negative relative to earth, the red LED will light.
QUESTIONS
20 Draw a diagram of a relay connected to the output of an op-amp. The relay should switch on a separate circuit containing mains voltage and a heater.
21 Why is a reverse-biased diode required for a relay but not for an LED?
The calibrated meter
An op-amp may be monitoring a physical quantity such as temperature or light intensity. It is helpful to display the value of that physical quantity directly on a meter and not to have to measure an output voltage and then calculate the physical quantity each time.
The output voltage of the op-amp is unlikely to be proportional to the physical quantity being measured, for example temperature. The numbers on a voltmeter connected to the output of an op-amp cannot simply be changed to read values of the physical quantity, but the voltmeter can still be calibrated in terms of the physical quantity.
Suppose that temperature is being measured and a digital voltmeter is connected to the output. Calibration can be achieved by placing the temperature sensor and a thermometer in a water bath and recording the voltmeter reading and the temperature of the water bath at a number of different temperatures. A calibration graph is then drawn, as shown in Figure 25.25.
6.0 5.0 4.0 3.0 2.0 1.0
Figure 25.25 A calibration curve relates the output voltage of an op-amp to the variable it is being used to measure.
The calibration curve is used to change any other voltmeter reading into a value for the physical quantity, in this case temperature.
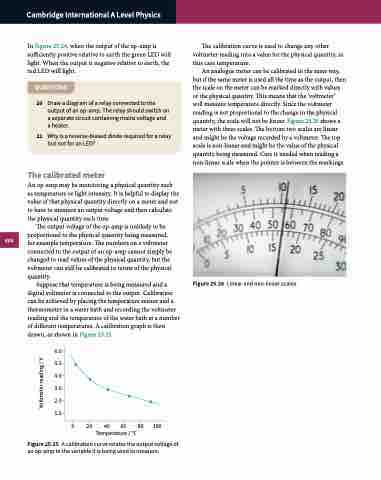
An analogue meter can be calibrated in the same way, but if the same meter is used all the time as the output, then the scale on the meter can be marked directly with values of the physical quantity. This means that the ‘voltmeter’ will measure temperature directly. Since the voltmeter reading is not proportional to the change in the physical quantity, the scale will not be linear. Figure 25.26 shows a meter with three scales. The bottom two scales are linear and might be the voltage recorded by a voltmeter. The top scale is non-linear and might be the value of the physical quantity being measured. Care is needed when reading a non-linear scale when the pointer is between the markings.
Figure 25.26 Linear and non-linear scales.
0 20 40 60 80 100 Temperature / °C
Voltmeter reading / V
