
Page 476 - Physics Coursebook 2015 (A level)
P. 476
Cambridge International A Level Physics
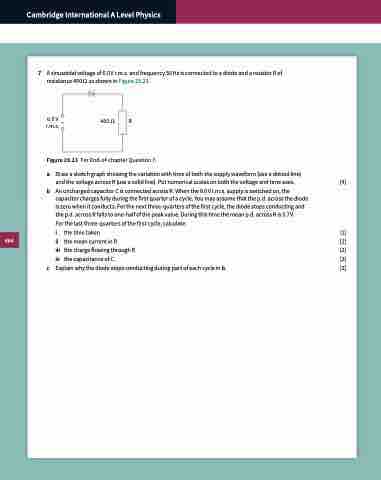
7 A sinusoidal voltage of 6.0 V r.m.s. and frequency 50 Hz is connected to a diode and a resistor R of resistance 400 Ω as shown in Figure 29.23.
6.0 V r.m.s.
R
400 Ω
Figure 29.23 For End-of-chapter Question 7.
a Draw a sketch graph showing the variation with time of both the supply waveform (use a dotted line)
and the voltage across R (use a solid line). Put numerical scales on both the voltage and time axes. [4]
b An uncharged capacitor C is connected across R. When the 6.0 V r.m.s. supply is switched on, the capacitor charges fully during the first quarter of a cycle. You may assume that the p.d. across the diode is zero when it conducts. For the next three-quarters of the first cycle, the diode stops conducting and the p.d. across R falls to one-half of the peak value. During this time the mean p.d. across R is 5.7 V.
For the last three-quarters of the first cycle, calculate:
i the time taken [1]
ii the mean current in R [2]
iii thechargeflowingthroughR [2] iv thecapacitanceofC. [2]
c Explain why the diode stops conducting during part of each cycle in b. [2]
464
