
Page 475 - Physics Coursebook 2015 (A level)
P. 475
Chapter 29: Alternating currents
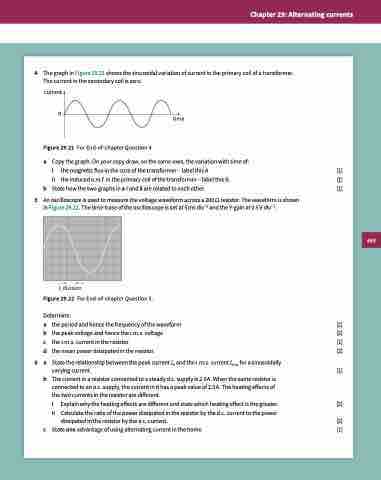
4 The graph in Figure 29.21 shows the sinusoidal variation of current in the primary coil of a transformer. The current in the secondary coil is zero.
current 0
Figure 29.21 For End-of-chapter Question 4.
time
a Copy the graph. On your copy draw, on the same axes, the variation with time of:
i the magnetic flux in the core of the transformer – label this A [1]
ii the induced e.m.f. in the primary coil of the transformer – label this B. [1]
b State how the two graphs in a i and ii are related to each other. [1]
5 An oscilloscope is used to measure the voltage waveform across a 200 Ω resistor. The waveform is shown
in Figure 29.22. The time-base of the oscilloscope is set at 5 ms div−1 and the Y-gain at 0.5 V div−1.
1 division
Figure 29.22 For End-of-chapter Question 5.
Determine:
a the period and hence the frequency of the waveform [2]
b the peak voltage and hence the r.m.s. voltage [2]
c the r.m.s. current in the resistor [1]
d the mean power dissipated in the resistor. [2]
6 a
State the relationship between the peak current I0 and the r.m.s. current Irms for a sinusoidally
varying current. [1]
b The current in a resistor connected to a steady d.c. supply is 2.0 A. When the same resistor is
connected to an a.c. supply, the current in it has a peak value of 2.0 A. The heating effects of the two currents in the resistor are different.
i Explain why the heating effects are different and state which heating effect is the greater. [2]
ii Calculate the ratio of the power dissipated in the resistor by the d.c. current to the power
dissipated in the resistor by the a.c. current. [2]
c State one advantage of using alternating current in the home. [1]
463
