
Page 508 - Physics Coursebook 2015 (A level)
P. 508
Cambridge International A Level Physics
496
fis
sion
usion
for 56Fe. This isotope of iron requires the most energy per 26
nucleon to dismantle it into separate nucleons; hence iron-56 is the most stable isotope in nature.
QUESTIONS
9 Explain why hydrogen 1H does not appear on the graph shown in Figure 31.4.
10 The mass of a 84Be nucleus is 1.33 × 10⁻²⁶ kg.
A proton and a neutron have a mass of about 1.67 × 10⁻²⁷ kg. For the nucleus of 84Be, determine:
a the mass defect in kg
b the binding energy
c the binding energy per nucleon.
Binding energy, fission and fusion
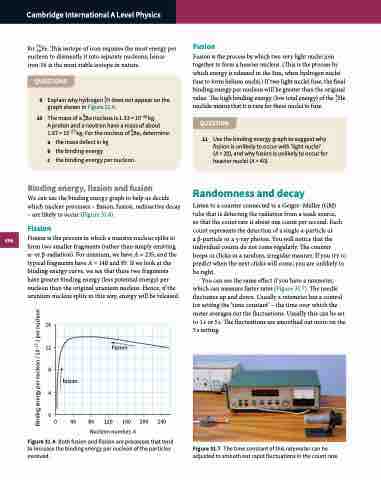
We can use the binding energy graph to help us decide which nuclear processes – fission, fusion, radioactive decay – are likely to occur (Figure 31.6).
Fission
Fission is the process in which a massive nucleus splits to form two smaller fragments (rather than simply emitting α- or β-radiation). For uranium, we have A = 235, and the typical fragments have A = 140 and 95. If we look at the binding energy curve, we see that these two fragments have greater binding energy (less potential energy) per nucleon than the original uranium nucleus. Hence, if the uranium nucleus splits in this way, energy will be released.
16 12 8
f 4
0
0 40 80 120 160 200 240
Nucleon number, A
Figure 31.6 Both fusion and fission are processes that tend to increase the binding energy per nucleon of the particles involved.
Fusion
Fusion is the process by which two very light nuclei join together to form a heavier nucleus. (This is the process by which energy is released in the Sun, when hydrogen nuclei fuse to form helium nuclei.) If two light nuclei fuse, the final binding energy per nucleon will be greater than the original value. The high binding energy (low total energy) of the 42He nuclide means that it is rare for these nuclei to fuse.
QUESTION
11 Use the binding energy graph to suggest why fission is unlikely to occur with ‘light nuclei’ (A < 20), and why fusion is unlikely to occur for heavier nuclei (A > 40).
Randomness and decay
Listen to a counter connected to a Geiger–Müller (GM) tube that is detecting the radiation from a weak source, so that the count rate is about one count per second. Each count represents the detection of a single α-particle or
a β-particle or a γ-ray photon. You will notice that the individual counts do not come regularly. The counter beeps or clicks in a random, irregular manner. If you try to predict when the next clicks will come, you are unlikely to be right.
You can see the same effect if you have a ratemeter, which can measure faster rates (Figure 31.7). The needle fluctuates up and down. Usually a ratemeter has a control for setting the ‘time constant’ – the time over which the meter averages out the fluctuations. Usually this can be set to 1 s or 5 s. The fluctuations are smoothed out more on the 5 s setting.
Figure 31.7 The time constant of this ratemeter can be adjusted to smooth out rapid fluctuations in the count rate.
Binding energy per nucleon / 10–13 J per nucleon
