Page 360 - Krugmans Economics for AP Text Book_Neat
P. 360
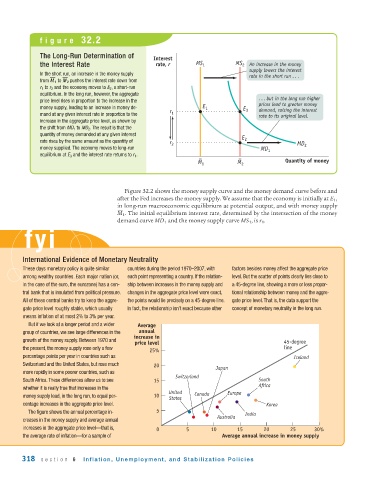
figure 32.2


              The Long -Run Determination of       Interest
              the Interest Rate                     rate, r      MS 1         MS 2 An increase in the money
                                                                                   supply lowers the interest
              In the short run, an increase in the money supply                    rate in the short run . . .


              from M 1 to M 2 pushes the interest rate down from
              r 1 to r 2 and the economy moves to E 2 , a short-run
              equilibrium. In the long run, however, the aggregate
                                                                                      . . . but in the long run higher
              price level rises in proportion to the increase in the
              money supply, leading to an increase in money de-    E 1           E    prices lead to greater money
                                                         r                        3   demand, raising the interest
              mand at any given interest rate in proportion to the  1                 rate to its original level.
              increase in the aggregate price level, as shown by
              the shift from MD 1 to MD 2 . The result is that the
              quantity of money demanded at any given interest
                                                                                E 2
              rate rises by the same amount as the quantity of
                                                         r 2                                      MD 2
              money supplied. The economy moves to long-run                           MD 1
              equilibrium at E 3 and the interest rate returns to r 1 .
                                                                                              Quantity of money
                                                                  M 1          M 2

                                          Figure 32.2 shows the money supply curve and the money demand curve before and
                                       after the Fed increases the money supply. We assume that the economy is initially at E 1 ,
                                       in long - run macroeconomic equilibrium at potential output, and with money supply

                                       M 1 . The initial equilibrium interest rate, determined by the intersection of the money
                                       demand curve MD 1 and the money supply curve MS 1 , is r 1 .
         fyi


         International Evidence of Monetary Neutrality
         These days monetary policy is quite similar  countries during the period 1970–2007, with  factors besides money affect the aggregate price
         among wealthy countries. Each major nation (or,  each point representing a country. If the relation-  level. But the scatter of points clearly lies close to
         in the case of the euro, the eurozone) has a cen-  ship between increases in the money supply and  a 45-degree line, showing a more or less propor-
         tral bank that is insulated from political pressure.  changes in the aggregate price level were exact,  tional relationship between money and the aggre-
         All of these central banks try to keep the aggre-  the points would lie precisely on a 45-degree line.  gate price level. That is, the data support the
         gate price level roughly stable, which usually  In fact, the relationship isn’t exact because other  concept of monetary neutrality in the long run.
         means inflation of at most 2% to 3% per year.
          But if we look at a longer period and a wider  Average
         group of countries, we see large differences in the  annual
                                             increase in
         growth of the money supply. Between 1970 and                                         45-degree
                                             price level
         the present, the money supply rose only a few  25%                                   line
         percentage points per year in countries such as                                         Iceland
         Switzerland and the United States, but rose much  20
                                                                        Japan
         more rapidly in some poorer countries, such as
                                                          Switzerland
         South Africa. These differences allow us to see  15                          South
                                                                                      Africa
         whether it is really true that increases in the
         money supply lead, in the long run, to equal per-  10  United  Canada  Europe
                                                        States
         centage increases in the aggregate price level.                                Korea
          The figure shows the annual percentage in-  5                          India
                                                                        Australia
         creases in the money supply and average annual
         increases in the aggregate price level—that is,  0   5       10       15      20       25      30%
         the average rate of inflation—for a sample of                    Average annual increase in money supply


        318   section 6     Inflation, Unemployment, and Stabilization Policies

