
Page 469 - Krugmans Economics for AP Text Book_Neat
P. 469
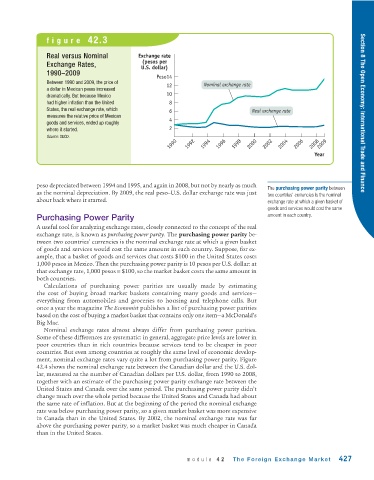
figure 42.3


                Real versus Nominal           Exchange rate
                                                (pesos per
                Exchange Rates,
                                               U.S. dollar)
                1990–2009
                                                    Peso14
                Between 1990 and 2009, the price of     12          Nominal exchange rate
                a dollar in Mexican pesos increased
                dramatically. But because Mexico        10
                had higher inflation than the United    8
                States, the real exchange rate, which   6                          Real exchange rate
                measures the relative price of Mexican  4                                                              Section 8 The Open Economy: International Trade and Finance
                goods and services, ended up roughly
                where it started.                       2
                Source: OECD.
                                                        1990  1992  1994  1996  1998  2000  2002  2004  2006  2008  2009
                                                                                                        Year


             peso depreciated between 1994 and 1995, and again in 2008, but not by nearly as much  The purchasing power parity between
             as the nominal depreciation. By 2009, the real peso–U.S. dollar exchange rate was just  two countries’ currencies is the nominal
             about back where it started.                                                exchange rate at which a given basket of
                                                                                         goods and services would cost the same
             Purchasing Power Parity                                                     amount in each country.
             A useful tool for analyzing exchange rates, closely connected to the concept of the real
             exchange rate, is known as purchasing power parity. The purchasing power parity be-
             tween two countries’ currencies is the nominal exchange rate at which a given basket
             of goods and services would cost the same amount in each country. Suppose, for ex-
             ample, that a basket of goods and services that costs $100 in the United States costs
             1,000 pesos in Mexico. Then the purchasing power parity is 10 pesos per U.S. dollar: at
             that exchange rate, 1,000 pesos = $100, so the market basket costs the same amount in
             both countries.
               Calculations of purchasing power parities are usually made by estimating
             the cost of buying broad market baskets containing many goods and services—
             everything from automobiles and groceries to housing and telephone calls. But
             once a year the magazine The Economist publishes a list of purchasing power parities
             based on the cost of buying a market basket that contains only one item—a McDonald’s
             Big Mac.
               Nominal exchange rates almost always differ from purchasing power parities.
             Some of these differences are systematic: in general, aggregate price levels are lower in
             poor countries than in rich countries because services tend to be cheaper in poor
             countries. But even among countries at roughly the same level of economic develop-
             ment, nominal exchange rates vary quite a lot from purchasing power parity. Figure
             42.4 shows the nominal exchange rate between the Canadian dollar and the U.S. dol-
             lar, measured as the number of Canadian dollars per U.S. dollar, from 1990 to 2008,
             together with an estimate of the purchasing power parity exchange rate between the
             United States and Canada over the same period. The purchasing power parity didn’t
             change much over the whole period because the United States and Canada had about
             the same rate of inflation. But at the beginning of the period the nominal exchange
             rate was below purchasing power parity, so a given market basket was more expensive
             in Canada than in the United States. By 2002, the nominal exchange rate was far
             above the purchasing power parity, so a market basket was much cheaper in Canada
             than in the United States.


                                                              module 42      The Foreign Exchange Market        427